Figure 3.
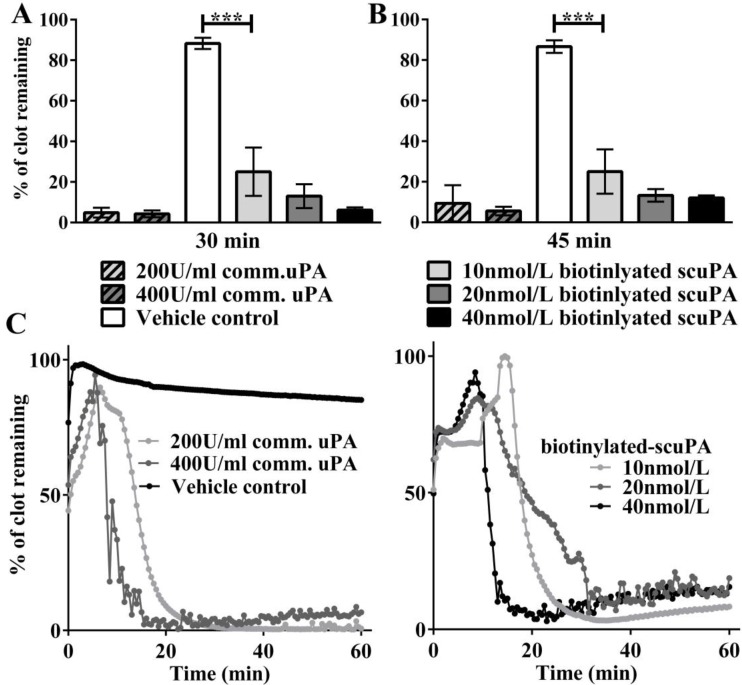
Fibrinolysis assay in a 96-well plate demonstrating successful thrombolysis with biotinylated scuPA. A. Bar chart showing % of clot remaining after 30 min of fibrinolysis. Commercial uPA at 200U/ml and 400U/ml showed strong fibrinolysis of clots as opposed to vehicle control, which did not show any fibrinolysis (n=5: p<0.001). Biotinlyated-scuPA at 10nmol/L, 20nmol/L and 40nmol/L also showed strong fibrinolysis as compared to the vehicle control (n=5; ***p<0.001). B. Bar chart showing % of clot remaining after 45 min of fibrinolysis. Similar results were obtained. C. Representative traces of the fibrinolysis assays are shown.

