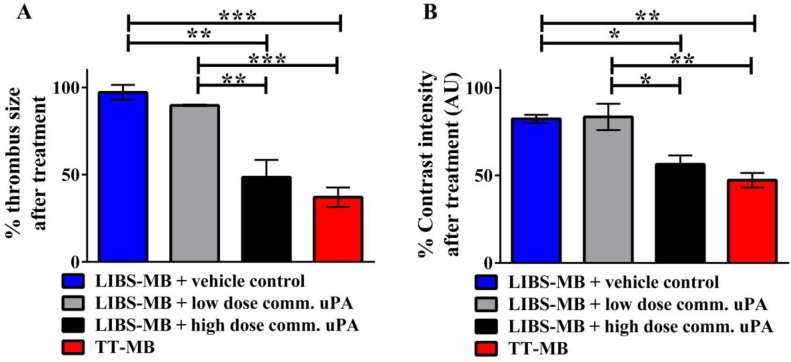
Figure 6.
Quantitative measurement on molecular ultrasound imaging showing the reduction in both thrombus size and contrast intensity after treatment with TT-MB. A. Bar chart showing % of thrombus size at the end point of molecular ultrasound imaging. A reduction of thrombus size was observed for animals administered with LIBS-MB and high dose of commercial uPA at 500U/g BW (black) as compared to LIBS-MB and saline (blue) as vehicle control. The same significant reduction of thrombus size was also observed with TT-MB (red), but not with LIBS-MB and low dose of commercial uPA at 75U/g BW (light grey). B. Bar chart showing % contrast intensity at the end point of molecular ultrasound imaging. Results were similar to those of % thrombus size. Baseline area and contrast intensity was set to 100% and areas were measured at the start and end of imaging. Groups were compared by use of one-way ANOVA with Bonferroni post tests for multiple comparison (Mean % ± SEM, (*p<0.05, **p<0.01, ***p<0.001, n≥3 each).

