
Fig. 4.
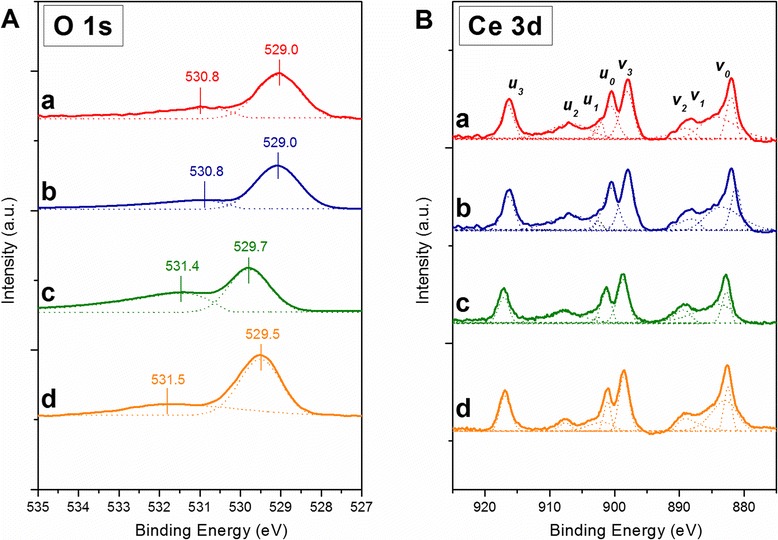
XPS spectra of the a Ce-NC, b Ce-NR, c Ce-MES, and d Ce-SCS samples in the O (1s) (a) and Ce (3d) core level regions (b). Adapted from ref. [30]
Official websites use .gov
A
.gov website belongs to an official
government organization in the United States.
Secure .gov websites use HTTPS
A lock (
) or https:// means you've safely
connected to the .gov website. Share sensitive
information only on official, secure websites.
XPS spectra of the a Ce-NC, b Ce-NR, c Ce-MES, and d Ce-SCS samples in the O (1s) (a) and Ce (3d) core level regions (b). Adapted from ref. [30]