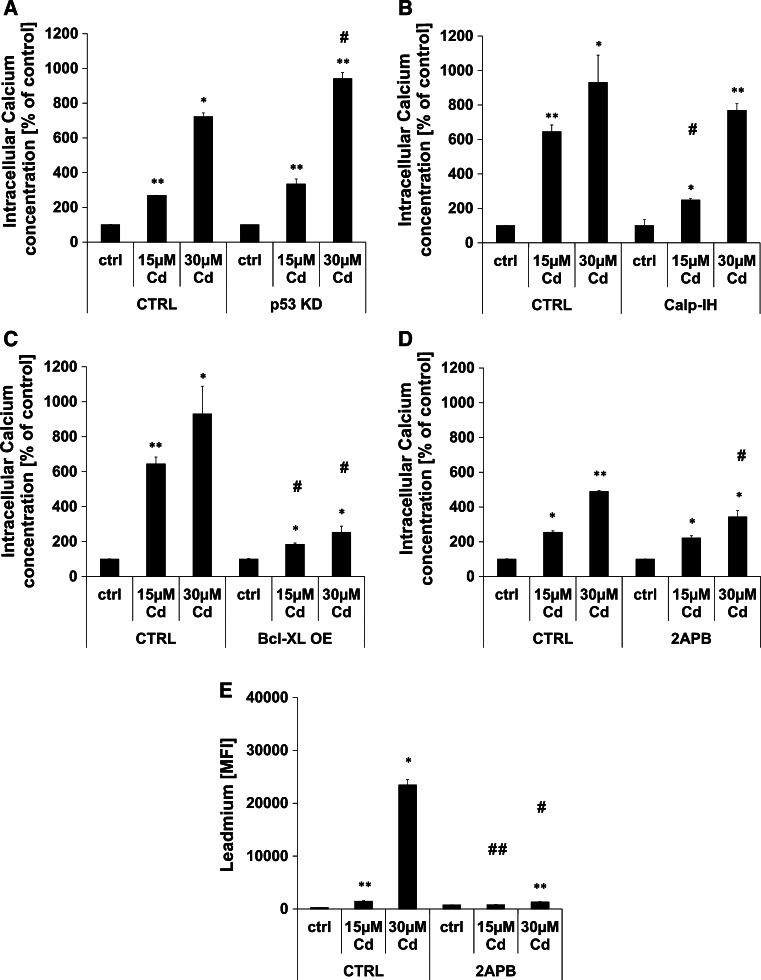
Fig. 2.
Cd induced increase in cytosolic Ca2+ concentration. a–d show flow cytometry-based quantifications of intracellular Ca2+ concentration after Cd treatment of endothelial cells for the indicated times. The effect of p53 KD (a), the incubation with calpain inhibitor (b), over-expression of BCL-XL (c), and of the incubation with 2APB (d) on cytosolic Ca2+ concentration is also depicted. e Shows flow cytometry-based analyses of the effect of 2APB on endothelial Cd uptake after 96 h. All experiments were performed in triplicates and were repeated at least three times. Results depict the mean ± standard deviation. Asterisks indicate significant differences compared to the corresponding (*p < 0.05; **p < 0.01) and hash signs indicate significant differences between the groups (# p < 0.05; ## p < 0.01)

