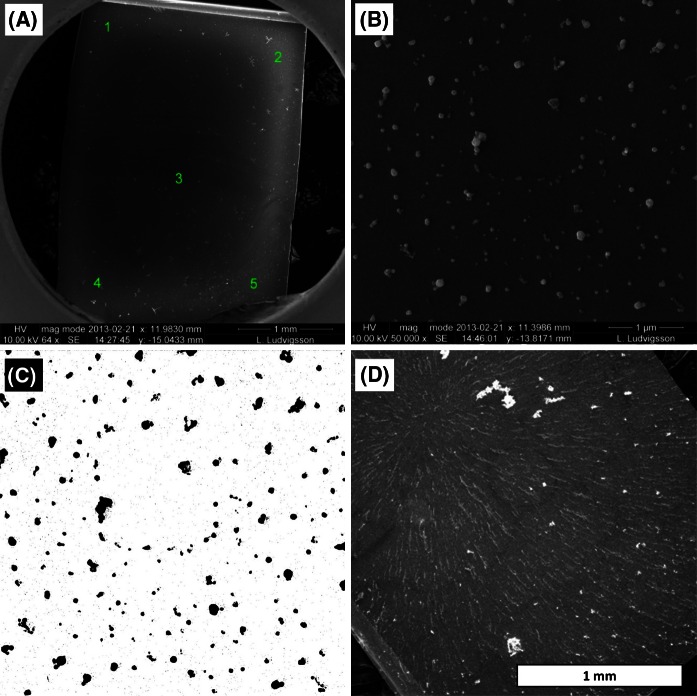
Fig. 10.
a Silica wafer with deposited polydisperse Ag, from well 6, for determination of deposition efficiency in the NACIVT. The analysis was performed on five areas over the wafer, each with three SEM images. b Sintered, spherical, polydisperse Ag aerosol deposited on silica wafer in the NACIVT. c Ag particles separated from the wafer background using imageJ software (Rasband 1997–2015). d Pd aggregates deposited on silica wafer in the NACIVT, the delivered particle amount is the highest used for cellular exposures. A deposition pattern reflection of the electromagnetic field orientation can be seen on the wafer

