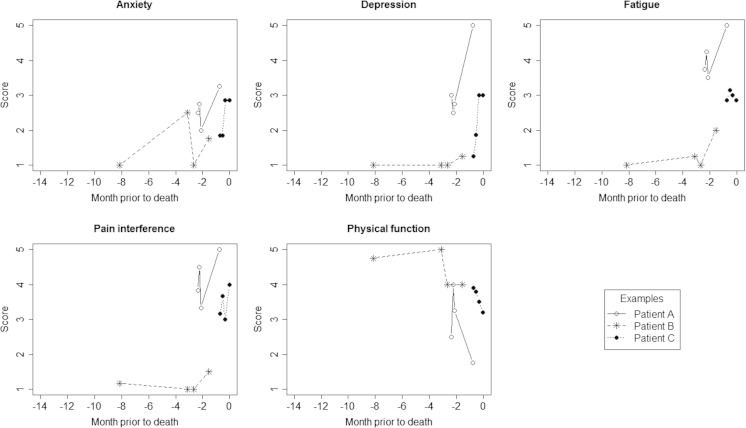
Fig. 1.
A plot of example assessment score values reported for three patients who died during the study period, for each PROMIS domain. Dates of assessment are indexed by months prior to death along the horizontal access, and mean domain score values reported for each assessment are represented on the vertical axis. Consecutive scores for example patients are linked by reference lines, for each of the three example patients identified in the plot legend

