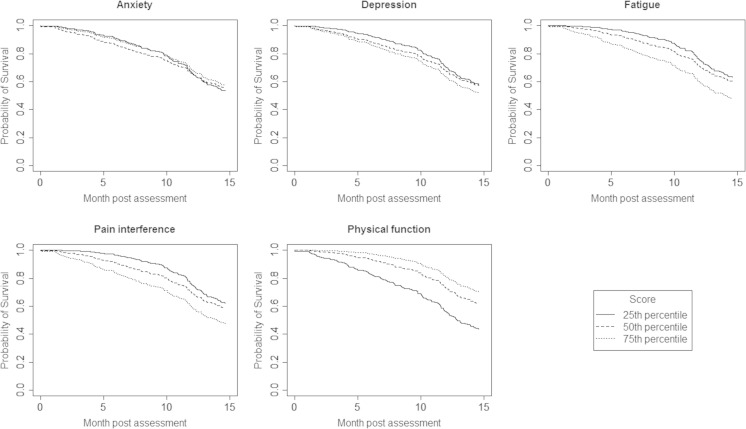
Fig. 3.
A plot of the survival functions estimated for all patients in the study population, with reference to the mean scores at the 25th, 50th, and 75th percentiles of the overall domain distributions, for each PROMIS domain. Months post assessment are indexed on the horizontal access. Estimated probabilities of survival are indexed on the vertical axis

