Figure 2.
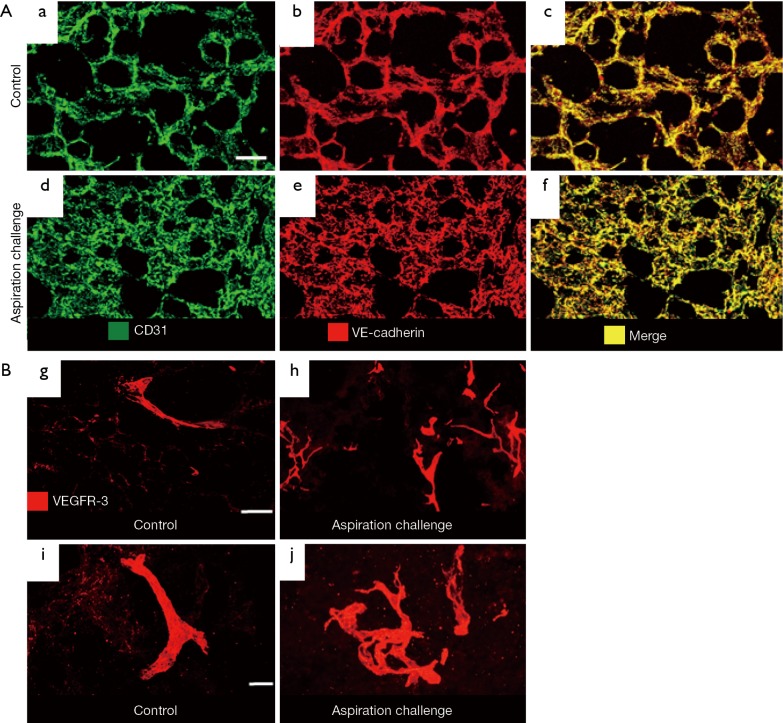
A mouse model of chronic micro-aspiration. (A) Greater blood vessel area density in the lung of the aspiration-challenged mice for 28 days. Staining for blood vessels (CD31 in green and VE-cadherin in red) in the control (a-c) and 28-day aspiration-challenged mice (d-f). Scale bar: 50 µm. (B) Exaggerated lymphangiogenesis in the lung of the aspiration-challenged mice for 28 days. Staining for lymphatics (VEGFR-3, red) in the control (g and i) and 28-day aspiration-challenged mice (h and j). Lymphatics in the control group (g and i) are distributed sparsely, whereas those in the aspiration group (h and j) are distributed densely. High-magnification images show a simple structure of lymphatics in the controls and a complex structure of lymphatics in the aspiration group. Scale bar: 100 µm in (g) and (h); 20 µm in (i) and (j). The data are from the same experiments (20) but not shown in (20).

