
Figure 3.
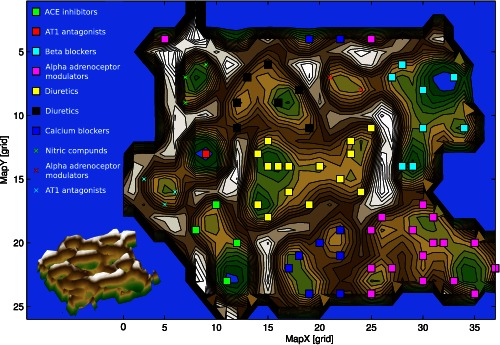
U‐Matrix top view (top) and three‐dimensional view (bottom) on a pseudo three‐dimensional map of the grouping of antihypertensive drugs in the high‐dimensional space. This is constructed by the vectors of each antihypertensive drug composed of the information about the drug's involvement in biological processes. The U‐Matrix32 is a representation of the distances in this space on top of a map space that consists of a two‐dimensional grid of 50 × 82 = 4200 units (“neurons”). The representation is intended for a geographical interpretation (for technical details of the presentation, see http://www.uni-marburg.de/fb12/datenbionik/forschung/esom). Brown or snow‐covered heights symbolizing large high‐dimensional distances between the antihypertensive drugs (see also the inserted three‐dimensional view of the same U‐Matrix at the bottom left corner), whereas green valleys or blue lakes represent small distances. In this geographical map analogy, the points (i.e., the “antihypertensives”), laying together in a valley of the U‐Matrix indicate that these drugs share a common pattern of biological processes (i.e., they are members of the same cluster). Watersheds in the U‐Matrix indicate borders between clusters. The dots represent the neurons, colored separately for each class of antihypertensives, that best represented a projection of the drugs functional genomics from the high dimensional onto the two‐dimensional space. The other neurons of the grid space are omitted. Please note that the projection grid is toroidal where opposite edges are connected. Classes of antihypertensives occurring twice indicate that the original pharmacologically assigned class had been identified as comprising subgroups, which were located at different places on the U‐Matrix.