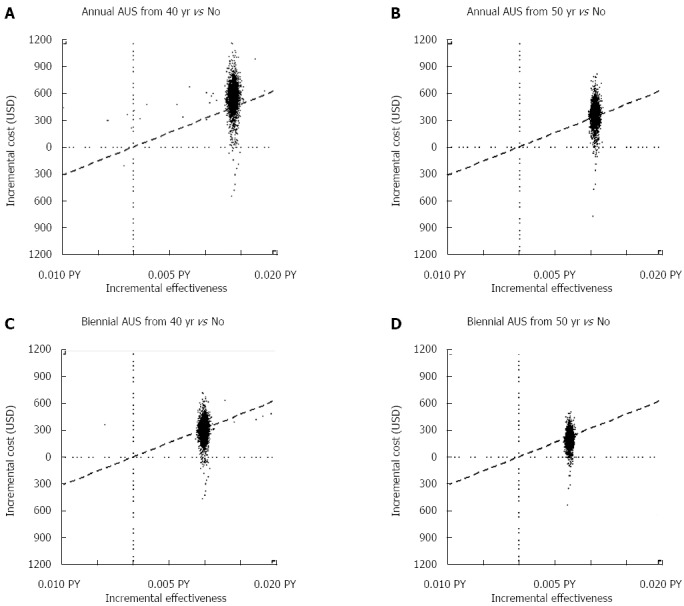
Figure 3.

Cost-effectiveness plane for different combinations of optimal, suboptimal initial ages and inter-screening intervals of ultrasonography screening. The slope of the dashed line represents the ceiling ratio. A: Annual screening from 40 years vs no screening; B: Annual screening from 50 years vs no screening; C: Biennial screening from 40 years vs no screening; D: Biennial screening from 50 years vs no screening.
