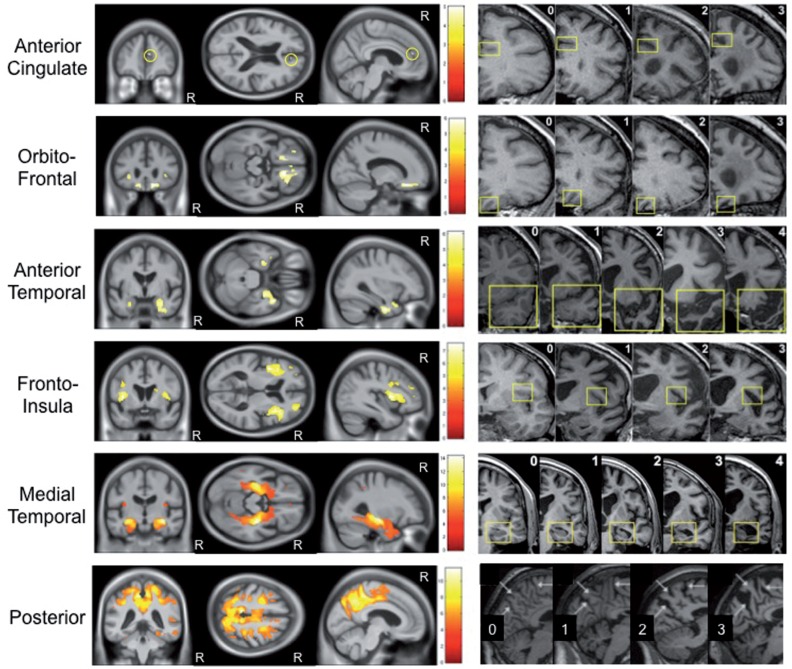
Figure 1.
Correlation between grey matter volume and visual rating score. Voxel-based morphometry images demonstrating negative partial correlation between grey matter volume and each visual rating scale, adjusted for the other scales (Y = β AC X AC + β OF X OF + β AT X AT + β FI X FI + β MTA X MTA + β PA X PA + β Age X Age + β Gender X Gender + β TIV X TIV + β 1T X 1T + β 3T X 3T + β London X London + β Amsterdam X Amsterdam + μ + e). In all images statistical significance of correlations was corrected for multiple comparisons (family wise error rate P < 0.05). The corresponding visual rating scale reference images are displayed adjacent to each statistical parametric map. R indicates the right hemisphere.

