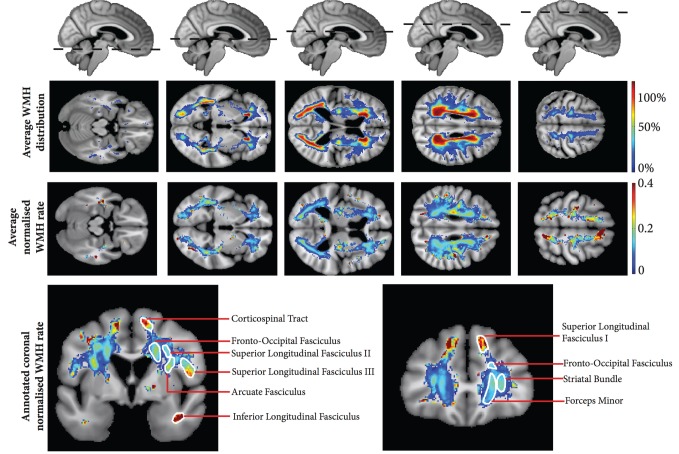
Figure 3.
Group average WMH rate maps. Axial projections of group average WMH rate maps shown using the neurological convention. Top row shows overall average over the group, bottom row has been normalized by averaging across individual subject voxels only where WMH is present and represents the average rate if WMH is found in a particular voxel. Bottom images display two coronal sections with annotation of the corresponding white matter anatomy according to Schmahmann’s white matter atlas ( Schmahmann and Pandya, 2009 ).

