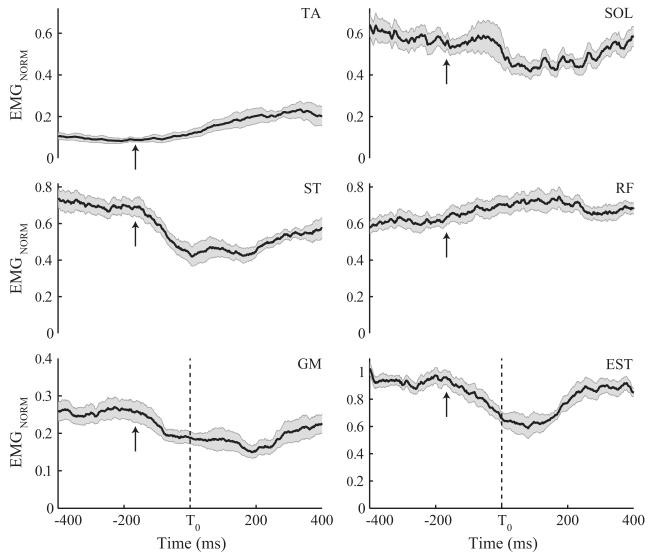
Figure 1.
Normalized EMG time profiles of a few selected muscles across the load-release (LR) trials for a representative PD subject: tibialis anterior (TA), soleus (SOL), gastrocnemius medialis (GM), biceps femoris (BF), rectus femoris (RF), and thoracic erector spinae (EST). The solid lines are the averages of the corresponding muscle activity across trials while the shaded areas shows one standard error. The vertical dashed lines represent the moment when the subject released the load. Arrows in the EMG panels mark the onset of APAs (tAPA).

