Figure 2.
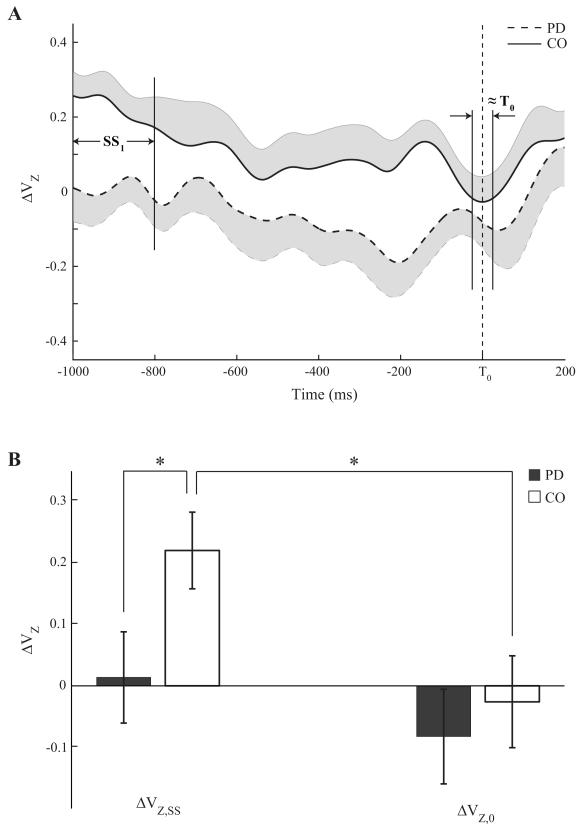
A: Time profiles of the synergy index (ΔVZ), averaged across patients (dashed line) and controls (solid line), during the load-release (LR) task. SS1 and ≈T0 are the time intervals selected for statistical analysis. Note the significantly higher ΔVZ in CO and the drop in this index before T0. B: Z-transformed synergy indices (ΔVZ) for the PD (black bar) and CO (white bar) groups over the SS1 and ≈T0 phases. Mean ± SE values across subjects within each group are shown. Statistically significant differences are marked with a star.

