Figure 5.
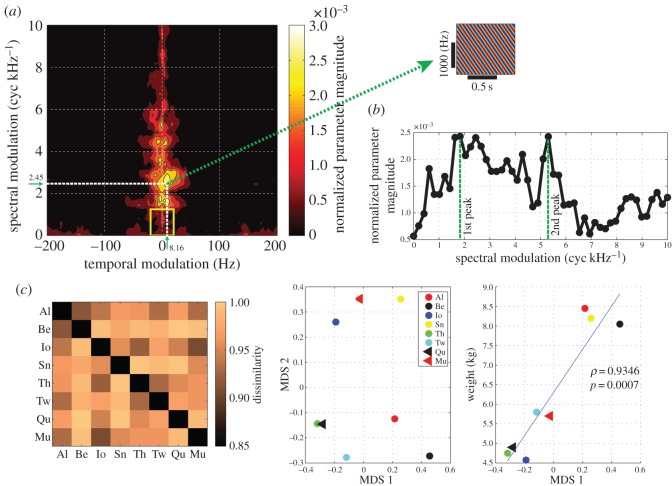
Classification analysis from the call MPS. The mean classification performance was 92%. (a) Normalized magnitude of the parameter in the softmax-link function of the multinomial classifier, averaged across the eight animals. They are normalized by the total magnitudes for each animal and then averaged across animals. The yellow square indicates the region with the range of spectral modulation of 0–1.2245 (cyc kHz−1) and the temporal modulation of ±16.3265 (Hz). Inset: the plane wave corresponds to the peak spectral and temporal modulation (2.45 (cyc kHz−1), 8.16 (Hz), indicated by the white dotted lines in the magnitude profile). (b) The normalized magnitude of the classifier coefficient at zero temporal modulation frequency is shown as a function of the spectral modulation frequency. The data values are the same as in those in (a). The first peak of this curve is located at 1.84 (cyc kHz−1), and the second peak is located at 5.30 (cyc kHz−1). (c) Classification analysis from the restricted component of MPS, indicated by the yellow square in (a). The mean classification performance was 73.6%. Left: the dissimilarity (or distance) matrix derived from the off-diagonal component of the confusion matrix in the classification analysis. Centre: the first two dimensions of MDS derived from the dissimilarity matrix on the left. Right: animal body weights as a function of the first dimension of MDS. The correlation coefficient between those two variables was 0.9346 (p=0.0007). The solid line indicates the linear regression.

