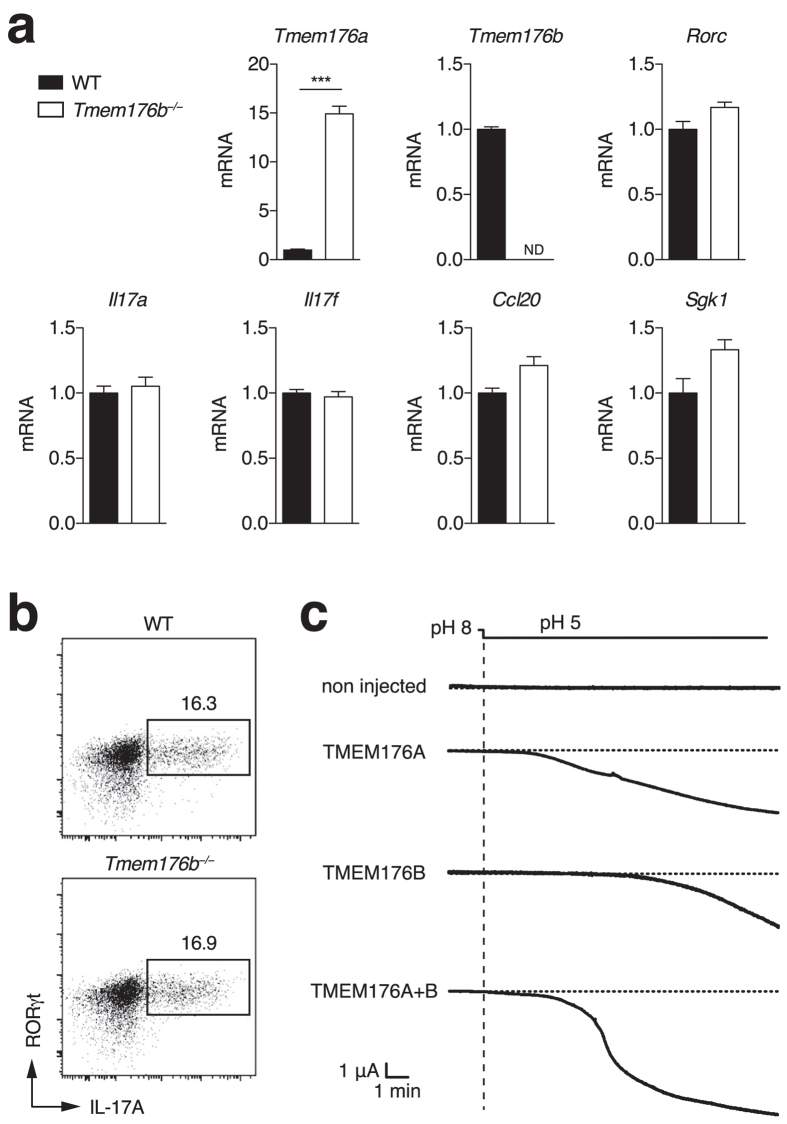
Figure 3. Expression compensation and ion channel activity of Tmem176a and b.
(a) Naive CD4+ T cells from WT or Tmem176b−/− mice were stimulated with anti-CD3 and anti-CD28 under Th17 polarising conditions for 3 days. Expression of indicated genes was assessed by quantitative RT-PCR. Data show triplicates (mean ± SD) for each condition and are representative of five independent experiments. **p < 0.01. ND: Not detected. (b) Intracellular RORγt and IL-17A expression was assayed by FACS after PMA/ionomycin restimulation. (c) Xenopus oocytes were injected with Tmem176a or/and Tmem176b mRNA and currents were recorded in voltage-clamp 2–4 days later. Translocation of TMEM176A and TMEM176B to the plasma membrane was induced by a 30-min treatment with PMA. The currents were quantified 5–15 min after holding the extracellular pH at 5. Representative recordings are shown.

