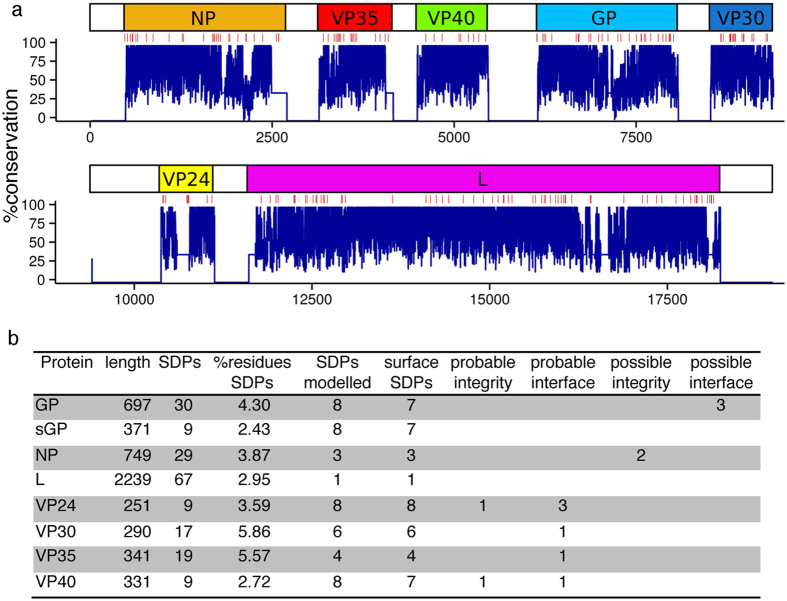
Figure 2. Ebolavirus SDPs.
(a) genomic overview of Ebolavirus conservation. SDPs are shown as red lines with protein conservation (blue graph). (b) The number of SDPs in each of the Ebolavirus proteins is shown with details on: the number of SDPs that were mapped onto protein structures and the numbers that were identified to have potential roles in changing pathogenicity by either affecting protein-protein interactions (interface) or changing protein structure-function. These changes were classed as probable, where there is high confidence of the effect and possible where there is a lower level of confidence in the observations.

