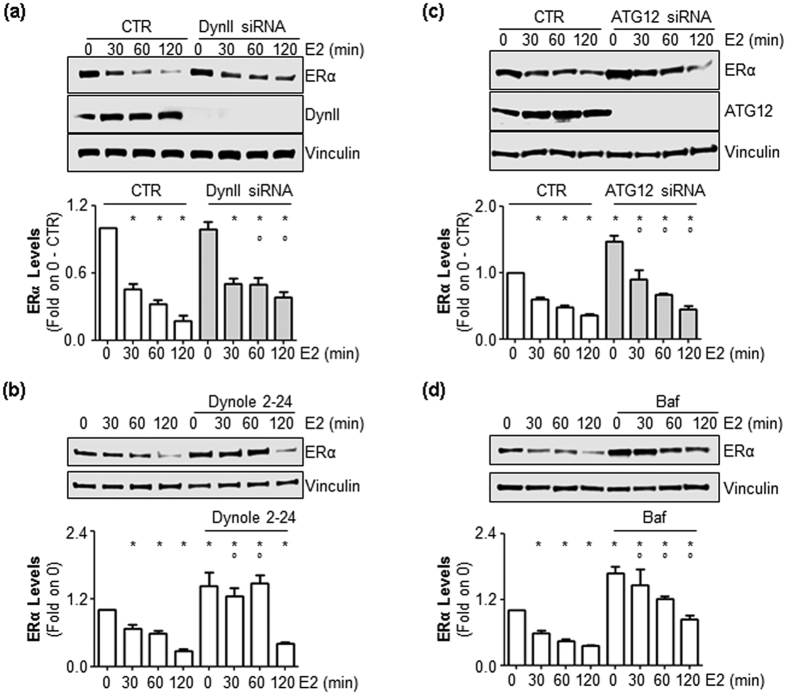
Figure 2. The role of DynII and autophagic flux on E2-induced ERα degradation.
(a) Western blotting analysis and relative densitometric analyses of ERα cellular levels in MCF-7 control (CTR), DynII (a) or ATG12 (c) knock-down cells and in dynole 2–24 (5 μM) (b) or in bafilomycin A1 (Baf) (100 nM) (d) pre-treated cells evaluated in the presence of E2 (10 nM) at different time points. The loading control was done by evaluating vinculin expression in the same filter. *indicates significant differences with respect to the control (0) sample; °indicates significant differences with respect to the corresponding E2 sample.

