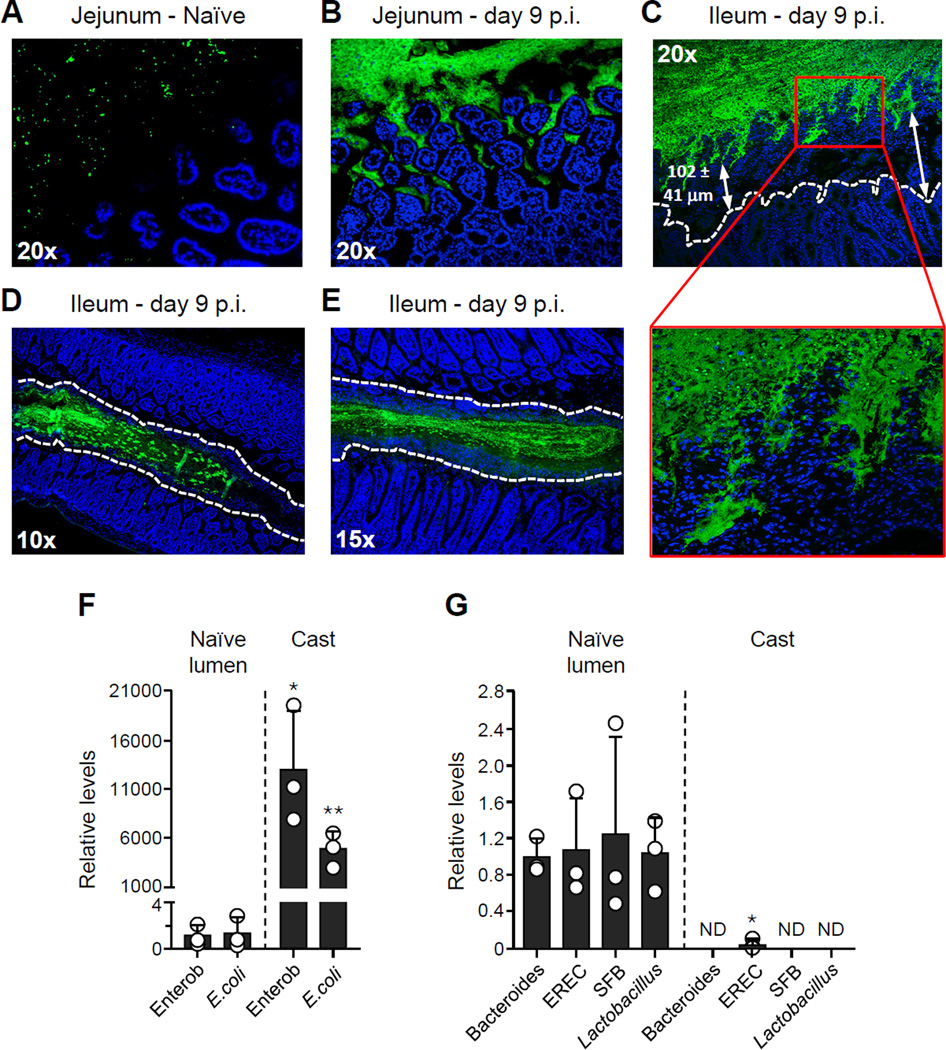
Figure 2. Intra-luminal cellular casts limit commensal contact with epithelium and control bacterial translocation during T. gondii infection.
Mice were orally infected with 15 T. gondii cysts. (A–E) Visualization of relative abundance and localization of bacteria by FISH in the small intestine. Sections were hybridized with a pan-bacterial 16S probe (green) and counterstained with DAPI to visualize nuclei (blue). (A–B) Sections from the jejunum of (A) naïve and (B) day 9 p.i. mice. (C–E) Sections from the ileum of day 9 p.i. mice. The white dashed lines represent the border of the ileal epithelium (C) or the border of the cellular casts that surround the bacteria (D–E). Red box shows area of increased segregation between bacteria and epithelia at higher magnification. (F–G) Bacterial 16S gene analysis of intra-luminal casts by semi-quantitative PCR using primers specific for the following: Enterobacteriaceae (Enterob), Escherichia coli (E.coli), Bacteroides, Eubacterium rectale/Clostridium coccoides (EREC) group, Segmented Filamentous Bacteria (SFB), and Lactobacillus/Lactococcus (Lactobacillus) group. Values are calculated relative to naïve. Open circles represent individual mice and each bar represents the mean ± SEM (*P<0.05, **P<0.01).

