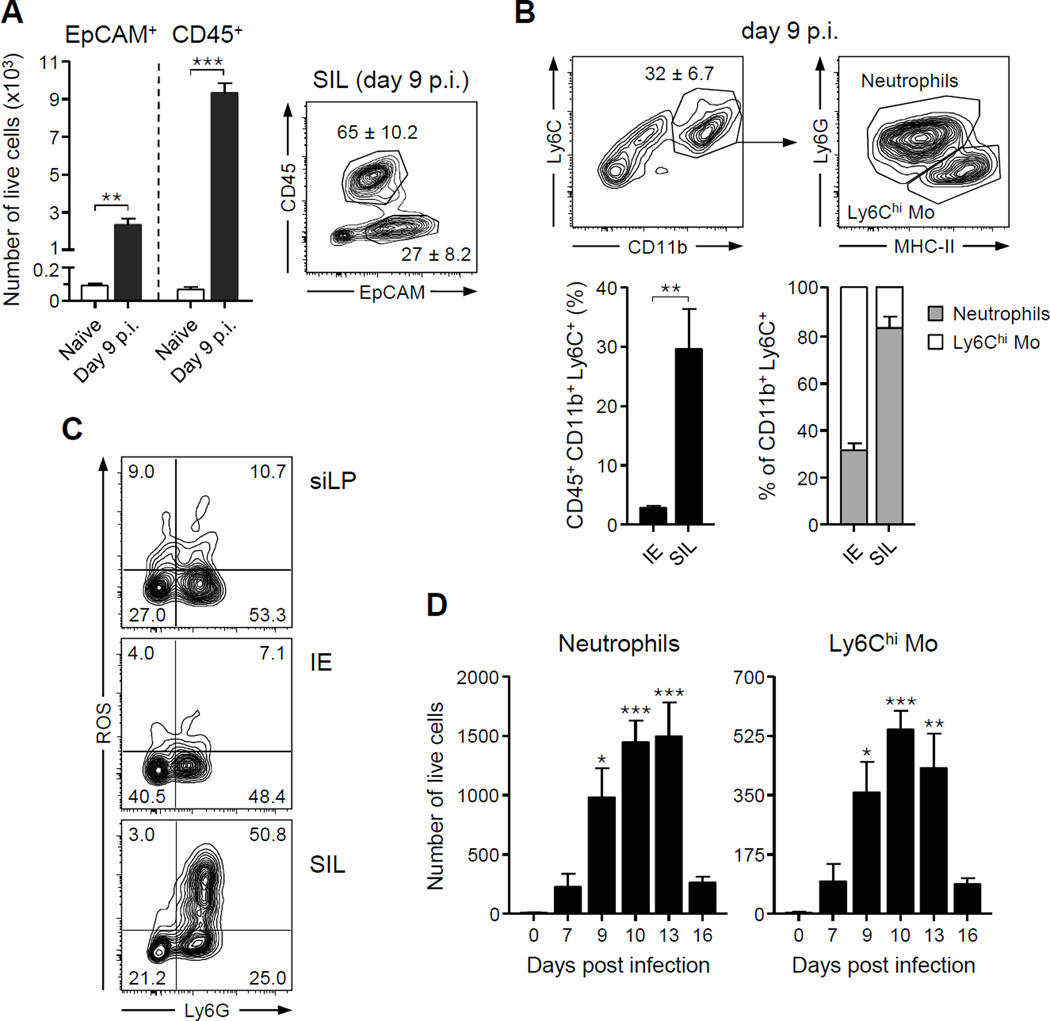
Figure 3. Neutrophils and inflammatory monocytes are major components of intra-luminal casts.
Cells from the luminal contents of naïve and T. gondii-infected mice (day 9 p.i.) were isolated and analyzed by flow cytometry. (A) Contour plot (right) shows endothelial and CD45+ hematopoietic cells. Numbers indicate the mean ± SEM percent in each gate. Bar graphs (left) show mean ± SEM of live cells isolated from the lumen of the small intestine. (B) Contour plots show the percent of luminal cells in the CD11b+Ly6C+ innate leukocytes (top left). Number indicates the mean ± SEM percent in the gate. CD11b+Ly6C+ cells were further classified as MHC-II+Ly6G− inflammatory monocytes and MHC-II−Ly6G+ neutrophils (top right). Bar graphs represent mean relative levels ± SEM of CD45+CD11b+Ly6C+ myeloid cells and the ratio of neutrophils and inflammatory monocytes in the Intra-Epithelial (IE) compartment and Small Intestinal Lumen (SIL). (C) ROS production by neutrophils (Ly6G+) and monocytes (Ly6G−) from the small intestine lamina propria (siLP), IE and SIL was analyzed directly ex vivo by flow cytometry. Contour plots are gated on live CD45+Ly6C+CD11b+ cells. Number in each quadrant represents the percent of total. (D) Total number of luminal inflammatory monocytes and neutrophils over the first two weeks of infection. All bar graphs represent the mean ± SEM of three to five mice analyzed. All data shown are representative of two to four independent experiments. *P<.05, **P<.01, ***P<.001. See also Figure S2.

