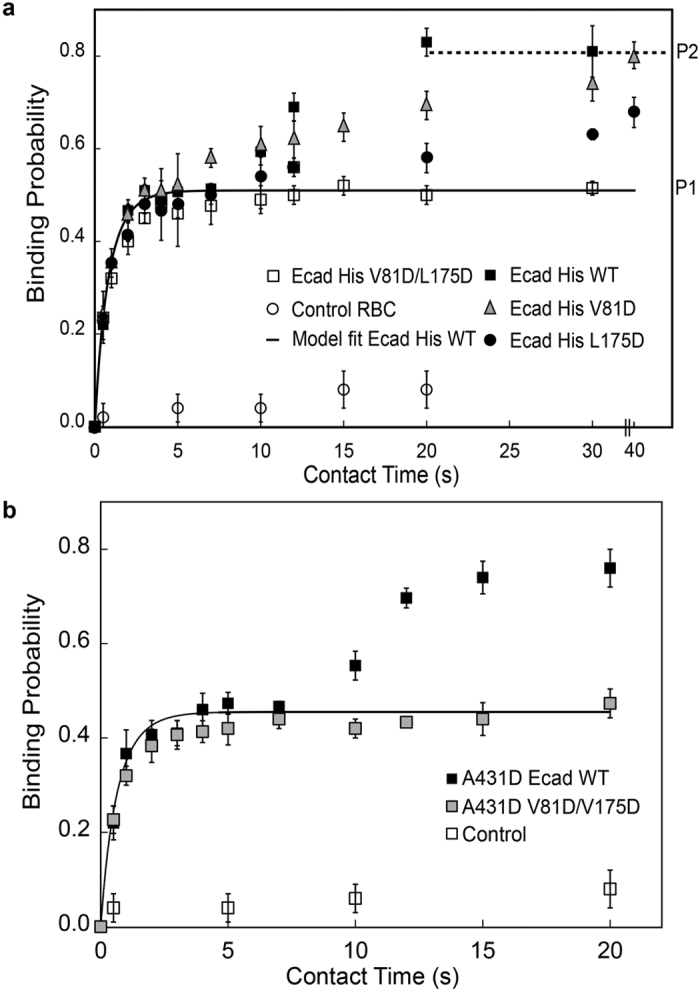
Figure 3. Binding Kinetics of Soluble and Membrane Bound E-Cadherin Variants.

(a) Mutations at the putative lateral binding interface alter the binding kinetics of recombinant E-cadherin ectodomains. The plot shows the binding probability versus contact time between two RBCs ectopically-modified with WT mouse E-Cad-His6 (black squares) or the mutants L175D (black circles), V81D (gray triangles) and V81D/L175D (white squares). The cadherin surface densities are summarized in Table 1. The solid line is a nonlinear least squares fit of Eq. 1 to the data corresponding to the first kinetic (WT mouse E-cadherin), with best fit parameters summarized in Table 1. Controls (white circles) used RBCs without immobilized E-Cad-His6. (b) Binding probability versus contact time between RBCs ectopically-modified with mouse E-Cad-His6 (WT or Double mutant), and A431D cells expressing Hu-E-Cad-GFP WT (black squares) or the V81D/L175D mutant (grey squares). The cadherin densities on the cell surface are summarized in Table 1. The solid line is the nonlinear least squares fit to Eq. 1 of data corresponding to the first kinetic step (Hu-E-Cad-GFP WT), with best fit parameters given in the text and summarized in Table 1. Controls (white squares) used A431D E-Cad-GFP WT cells and RBCs without immobilized E-Cad-His6.
