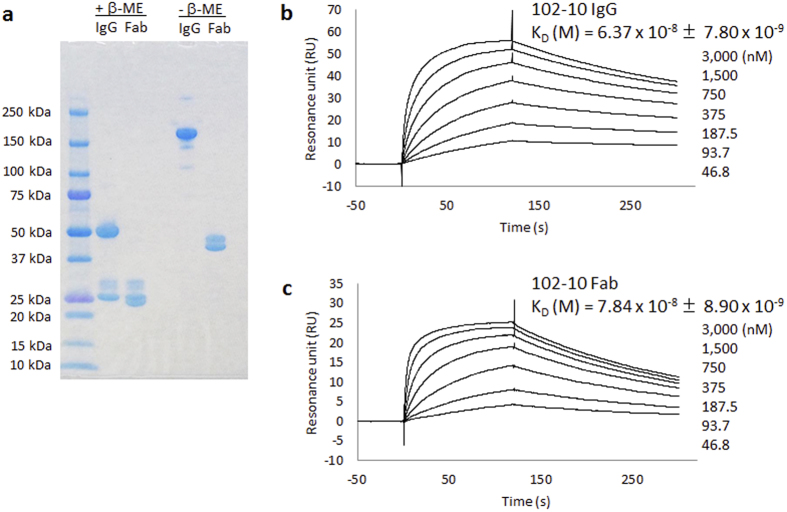
Figure 1. Characterization of 102-10 IgG and 102-10 Fab.
(a) SDS-PAGE of 102-10 IgG and 102-10 Fab under reducing or non-reducing conditions. The binding activities of 102-10 IgG and Fab were evaluated by SPR analysis. Binding plots of 102-10 IgG (b) and Fab (c) by SPR imaging. Different concentrations of 102-10 IgG or Fab were injected onto a Biacore sensor chip containing an immobilized epitope peptide. An increase in the SPR signal was observed from 46.8 nM to 3,000 nM for both antibodies. The association of the Fab with the antigen was slower than that of the IgG. The dissociation of Fab from the antigen was more rapid than that of IgG. Each KD value was represented as a mean value with standard deviation (n = 4); P < 0.05.

