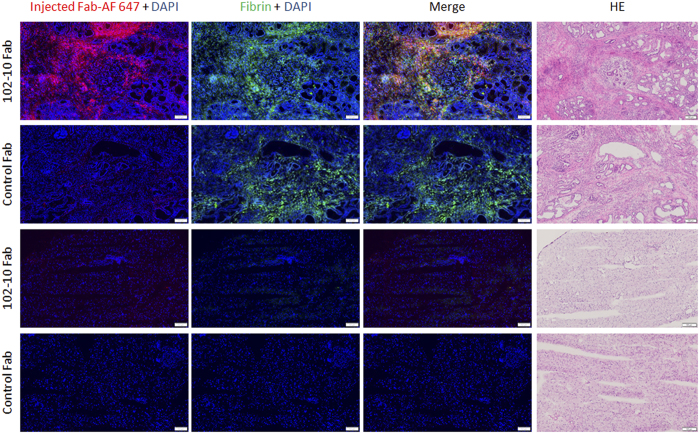
Figure 4. Localization of injected Fab probe and fibrin deposition in the PDAC or normal pancreas.
The mouse PDAC (upper two rows) or normal pancreas (lower two rows) sections which were prepared from the mouse injected with 102-10 Fab- or control Fab-AF 647 probe were examined using fluorescence and optical microscopy. Red, blue and green indicate Fab probe, DAPI and fibrin deposition, respectively. Yellow indicates the overlap of the injected 102-10 Fab-AF 647 and deposited fibrin. The scale bar represents 100 μm.

