
Figure 1. Histogram of BMI distribution for females and males.
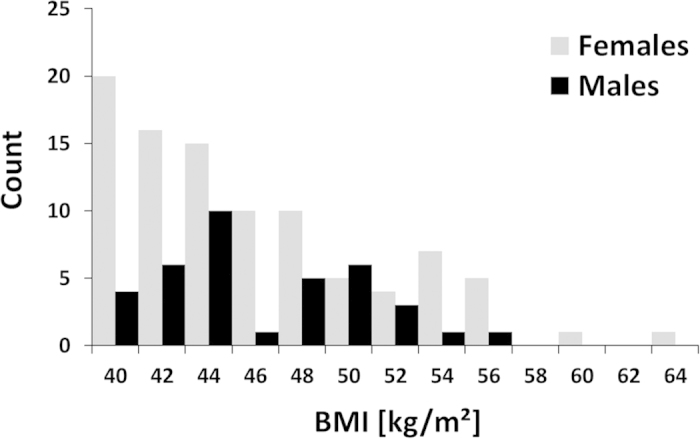
Mean BMI values were 46.4 ± 5.4 (40.3–64.1) kg/m2 and 46.6 ± 4.3 (range 40.1–57.0) kg/m2, respectively.
Official websites use .gov
A
.gov website belongs to an official
government organization in the United States.
Secure .gov websites use HTTPS
A lock (
) or https:// means you've safely
connected to the .gov website. Share sensitive
information only on official, secure websites.
Mean BMI values were 46.4 ± 5.4 (40.3–64.1) kg/m2 and 46.6 ± 4.3 (range 40.1–57.0) kg/m2, respectively.