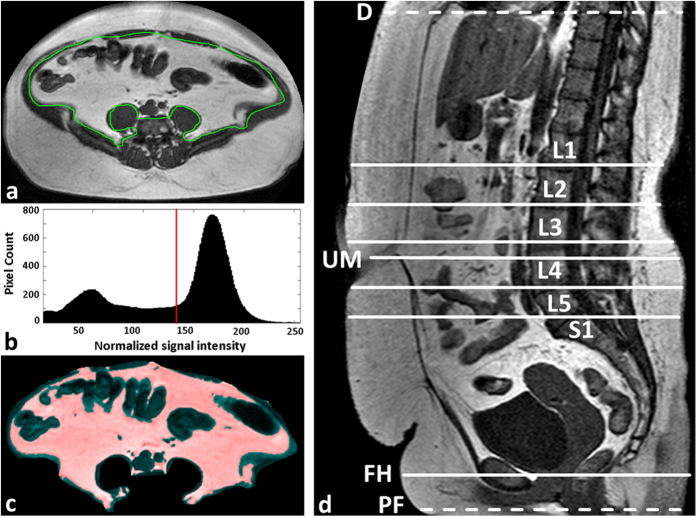
Figure 2. Semi-automated quantification of VAT volume.
(a) Automatic segmentation and manual correction of the VAT contour (green). (b) Histogram of normalized MRI signal intensities (SI) of all pixels within the VAT ROI. All pixels with SI above the predefined but adjustable threshold (red line, typically between lean and fat peaks) are considered as VAT. (c) MR image of ROI with VAT pixels overlaid semi-transparently in red. (d) Quantitative VAT areas AVAT were assessed on axial MRI slices at the following reference positions (landmarks): umbilicus (UM), femoral heads (FH), and intervertebral discs L1-L2, L2-L3, L3-4, L4-5 and L5-S1. Total VAT volume (VVAT) was analysed between pelvic floor (PF) and diaphragm (D).

