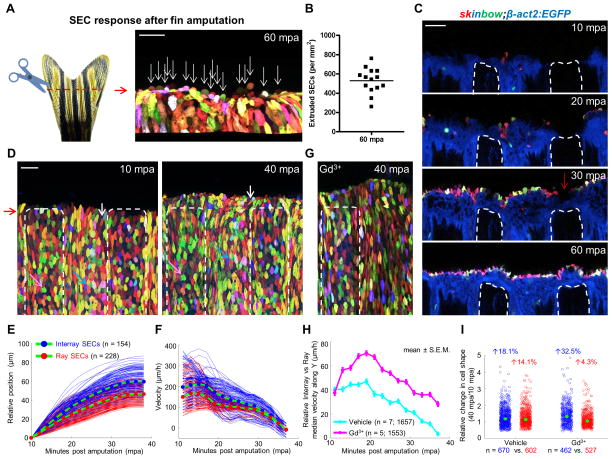
Figure 5. Ray and Interray Epithelial Sheets Respond Distinctly to Amputation Injury.
(A) (Left) Schematic of fin amputation. (Right) Confocal image indicating extruded SECs at the amputation plane by 60 minutes post amputation (mpa). A three-dimensional image was reconstructed from z-stacks of confocal images, using Imaris to facilitate counting of extruded cells. White arrows point to extruded cells along the amputation plane. Scale bar, 50 μm.
(B) Quantification of extruded SECs at the injury site at 60 minutes post amputation (n = 14 regions from 7 animals).
(C) Time lapse images of optical sections at the same z-position post amputation. Images were captured every 10 minutes starting at 10 minutes post amputation. White dashed lines outline fin rays. Red arrow indicates that the fin ray stump is covered first by basal and suprabasal cells, closed trailed by SECs. Scale bar, 50 μm.
(D) Confocal images captured at 10 and 40 mpa. White dashed lines outline regions covering fin rays. Images were recorded every 2 minutes for 30 minutes starting at 10 mpa. White, pink, and blue arrows point to individual cells at 10 and 40 mpa. Scale bar, 50 μm.
(E) Position of single cells perpendicular to the amputation plane with respect to starting position. Average trajectories are plotted in green lines with blue (interray SECs) and red (ray SECs) filled circles.
(F) Velocities were obtained by single cell tracking as finite differences.
(G) A confocal image captured at 40 mpa from animals treated with gadolinium (Gd3+). White dashed lines outline regions covering fin rays.
(H) Relative velocity of interray with respect to ray SECs in vehicle- (cyan, n = 7) vs Gd3+-treated animals (magenta, n = 5) averaged over all trajectories first and then over different samples. Data are plotted as mean ± S.E.M. Gd3+ treatment increases differential migration rates of interray SECs with respect to ray SECs. Additionally, migration persists in Gd3+-treated animals beyond 40 min.
(I) Quantification of relative changes in cell shape for interray SECs (blue) and ray SECs (red) in either vehicle- or Gd3+-treated animals. Cell shape was determined by aspect ratio, which was obtained as the major to minor axis ratio for each cell. The aspect ratio of individual cells at 40 mpa was normalized to the average value at 10 mpa to show relative change. Total numbers of analyzed trajectories are indicated below each point cloud, combined from 7 (vehicle) and 5 (Gd3+) animals. Mann-Whitney test of vehicle vs. Gd3+ interray SECs (blue circles) yielded a significant difference in the medians (green dots) of the two samples (p = 0.0038). See also Figure S5, and Movies S4, S5 and S6.

