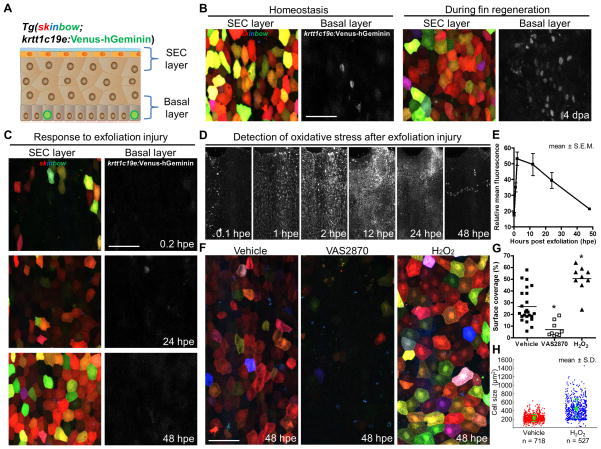
Figure 7. SEC Regeneration After Exfoliation Is Regulated by Injury-Induced ROS.
(A) Schematic of cell layers that are labeled in skinbow; krtt1c19e:Venus-hGeminin skin.
(B) Images of SECs and cycling basal progenitor cells (grayscale) under homeostatic conditions (left) and 4 days following fin amputation (right), indicating intense basal cell proliferation during fin regeneration. Images of SEC and basal layers were maximum-projected from respective z-positions. Scale bar, 50 μm.
(C) A time lapse imaging series showing SEC regeneration after exfoliation, indicating minimal basal progenitor cell cycle entry. Scale bar, 50 μm.
(D) A time lapse imaging series displaying transient ROS presence in the fin epithelium after exfoliation. ROS were indirectly detected as oxidative stress in vivo using Cellrox, a cell-permeable fluorescent probe.
(E) Quantification of the relative change in fluorescence intensity after exfoliation from experiments in (D). Data are plotted as mean ± S.E.M (n = 6 animals).
(F) Representative images of fin SECs at 48 hpe after various treatments. Animals were continuously treated in chemicals that either inhibit (VAS2870) or enhance (H2O2) ROS presence after injury.
(G) Quantification of surface coverage in the fin epithelium at 48 hpe. Horizontal Bars indicate mean in each group (n = 9 to 24 animals). Statistical significance between vehicle and treated groups was assessed by a two-tailed t-test (vehicle vs. VAS2870, or H2O2; p < 10−3 for both cases).
(H) Quantification of SEC size in the fin epithelium at 48 hpe. Quantification of cell size for vehicle (red) and H2O2 (blue) treated animals (n = 8 vs. 5 animals). Total numbers of analyzed cells are indicated below each point cloud. Bars indicate mean ± S.D. Statistical significance between the vehicle and H2O2 groups was assessed by a two-tailed t-test, p < 10−4 for either collapsing all single cell data together or using the means of different animals. The vehicle group has cell size of 212.50 ± 3.09 μm2, vs. 411.36 ± 9.70 in the H2O2-treated group. See also Movie S7.

