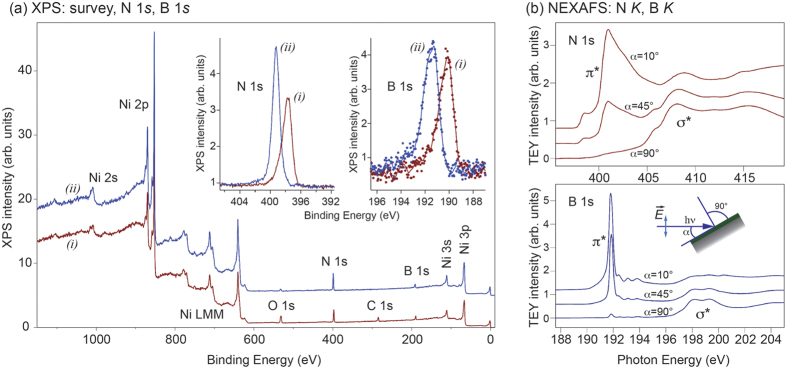
Figure 2. XPS and NEXAFS of h-BN/Ni(111).
(a) XPS survey spectra obtained with Al Kα radiation for as-transferred into UHV h-BN/Ni(111) sample (i) and after annealing the same sample at 400 °C (ii). The main core-level and Auger emission lines are marked in the Figure. Insets show the corresponding highly resolved XPS spectra of the N 1s and B 1s core levels. (b) TEY NEXAFS spectra of h-BN/Ni(111) collected as functions of photon energy at the K absorption edges of N and B for different incident angles α between the sample plane and the incoming light (angles are marked in the figure).

