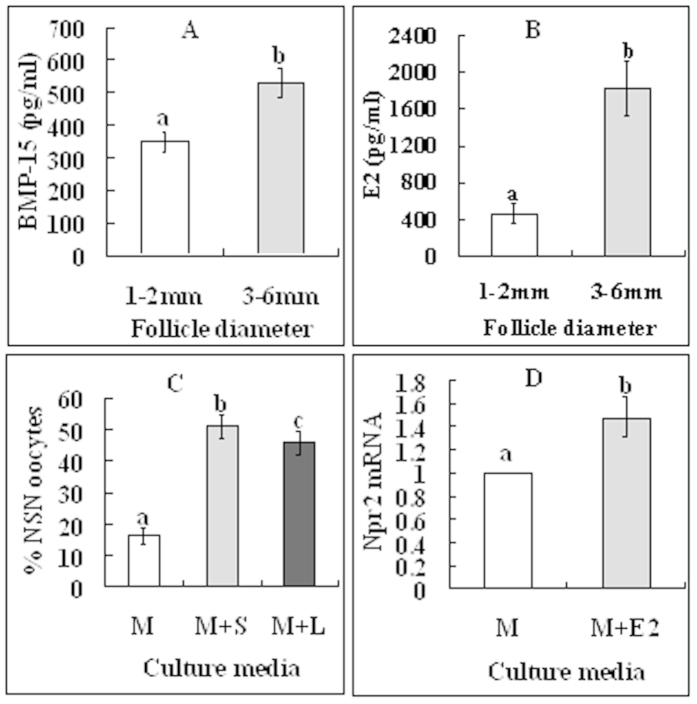
Figure 6. Roles of ODPF and estradiol in regulating the NSN-to-SN transition.
(A,B) show concentrations of BMP-15 and E2, respectively, in follicular fluid from 1–2 mm and 3–6 mm follicles. Each treatment was repeated 3 times with each replicate containing follicular fluid from 50 follicles. (C) shows percentages of NSN oocytes after culture of COCs from 1–2 mm follicles in TCM-199 (M) with (+) or without ODPF inhibitors, SB431542 (S) for GDF9 or LDN193189 (L) for BMP15. Each treatment was repeated 3 times with each replicate containing 25 COCs. (D) shows relative levels of Npr2 mRNA in CCs after culture of COCs from 1–2 mm follicles in TCM-199 (M) with (+) or without E2. Each treatment was repeated 3 times with each replicate containing CCs from 200 COCs. (a–c) Values without a common letter above their bars differ significantly (P < 0.05).

