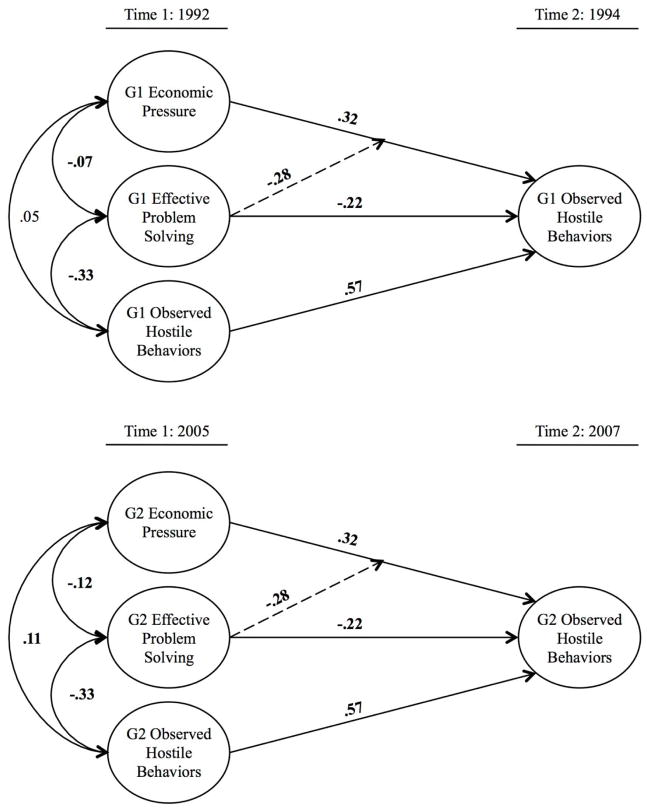
Figure 3.
The Interaction Effects Model to Test the Buffering Resilience Hypothesis (H3). In a Single Model, Each Regression Pathway Was Constrained to Be Equal for Generation 1 (G1) and Generation 2 (G2) Couples. Education, Income, and Conscientiousness Were Included As Controls and Analogous G1 and G2 Constructs Were Estimated (i.e., Intergenerational Associations), but Are Not Shown for Clarity of Presentation. Estimates Are Unstandardized. Single-headed Arrows Are Regression Pathways Illustrating Main Effects. The Broken Single-headed Arrow Represents the Interaction or Buffering Pathway. Double-headed Arrows Represent Correlations. T1 = Time 1; T2 = Time 2. Bolded Coefficients Are Statistically Significant (P ≤ .05).

