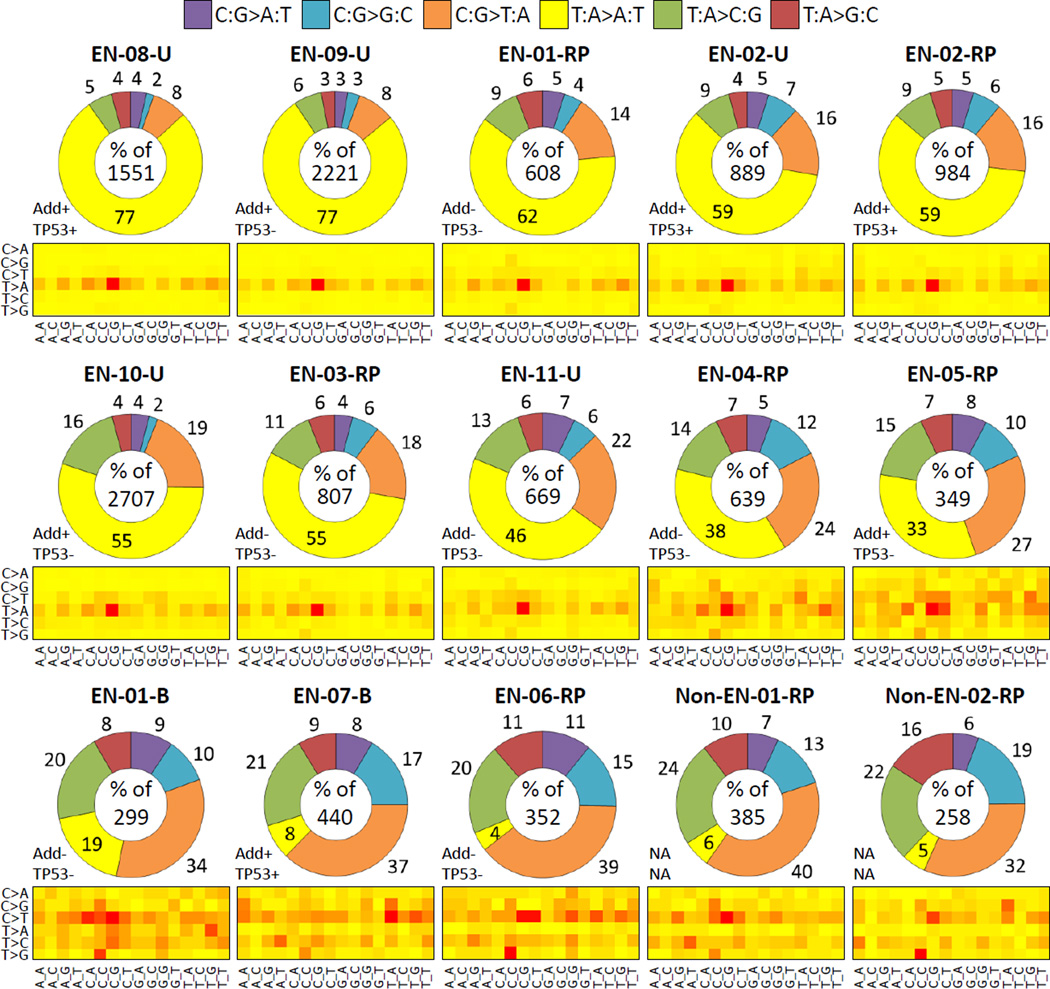
Figure 1. SBS alterations in urothelial tumors analyzed by LC-WES.
The distribution of six SBS types and their trinucleotide context are shown for variants detected at ≥3x per-base coverage. The doughnut charts correspond to individual samples (sample ID on top), ordered from high to low percentage of A>T. Total SBS counts per sample are provided in the center of each graph. The numbers outside the chart sections denote each mutation type percentage. The suffix -B, -RP and -U stands for bladder, renal pelvis and ureter, respectively. Add+/− = sample positive or negative for aristolactam-DNA adducts; TP53+/− = mutated (+) or wild-type (−) TP53 gene. The heat-maps summarize relative frequencies of the six mutation types (C>A stands for C:G>A:T etc.) across the 16 possible trinucleotide contexts listed at the bottom. Red=high frequency, yellow=low frequency.

