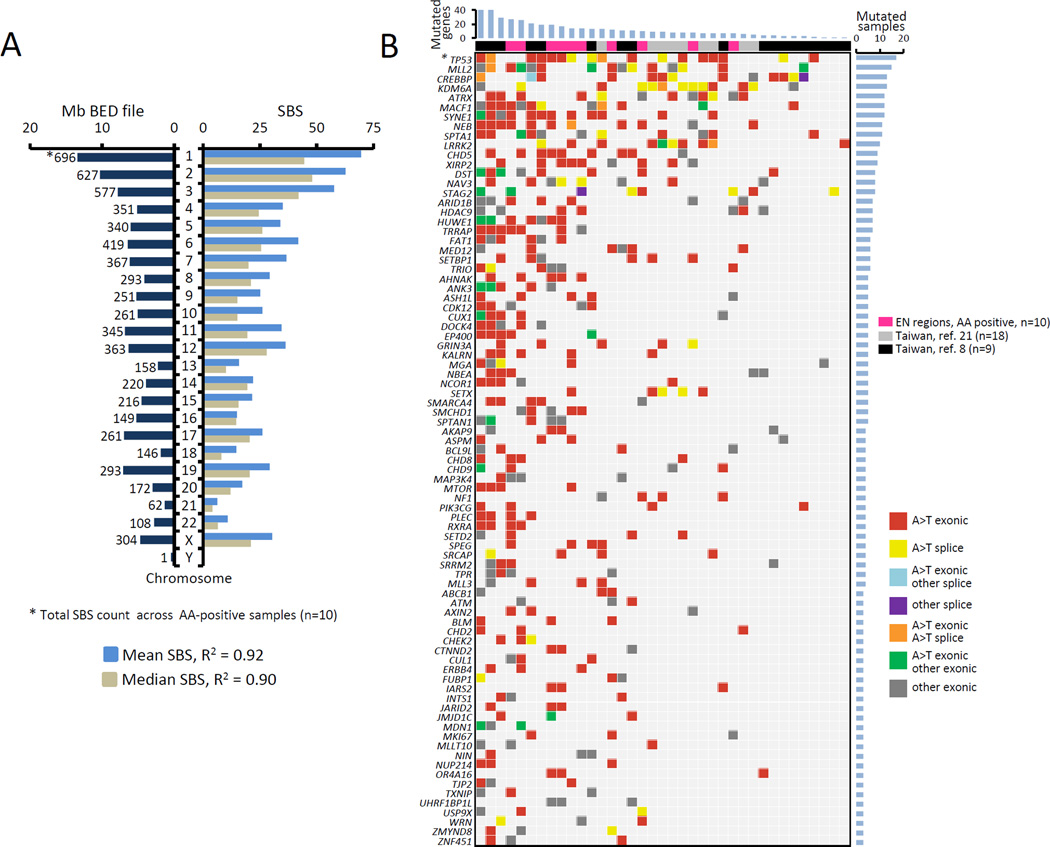
Figure 3. Distribution of A>T mutations and their impact on cancer driver genes.
A) Correlation (squared Pearson product-moment correlation coefficient R2) between the mean (light blue) and median (gray) values of A>T SBS counts per chromosome and the chromosome size in Mb (dark blue, left side). Variants based on ≥3 unique reads were considered. B) Meta-analysis of recurrently mutated genes in AA-associated UTUC. Genes with non-synonymous SBS variants identified in this study were compared with gene mutants found by two previously published AAN-UTUC data sets from Taiwan (8, 21). * = TP53 mutations combine results from the AmpliChip and LC-WES analyses. The list of recurrently mutated genes was narrowed down to cancer driver genes only, as described in Materials and Methods. See also Supplementary Table S4 for detailed annotation of these mutations.

