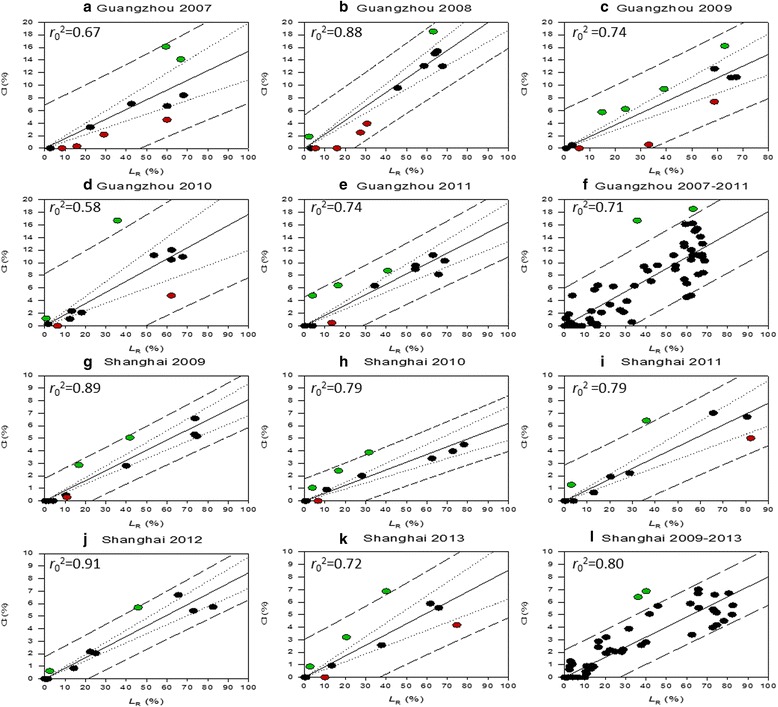
Fig. 7.

Zero-intercept r-square values (r 0 2) derived from the regression analysis between observed monthly larval Container Index (CI) and simulated monthly relative larval abundance (L R) for a-f Guangzhou, 2007–2011 and g-l Shanghai, 2009–2013. Green dots represent underestimation of the model and red dots represent overestimation. Dashed lines (-▪-) are thresholds of the predicted interval, while dotted lines (▪▪▪) are thresholds of the confident interval
