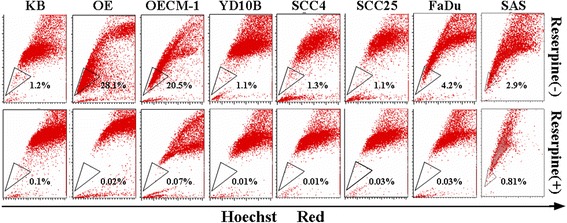
Fig. 1.

Percentage of side population cells in oral squamous cell carcinoma cells lines. Eight human oral squamous cell carcinoma cell lines were stained with Hoechst 33342 dye in the presence (bottom) or absence (upper) of 50 μM reserpine and analyzed by flow cytometry. The side population cells (black triangle), which were disappeared by reserpine, are shown as a percentage of the whole living cell population
