Fig. 3.

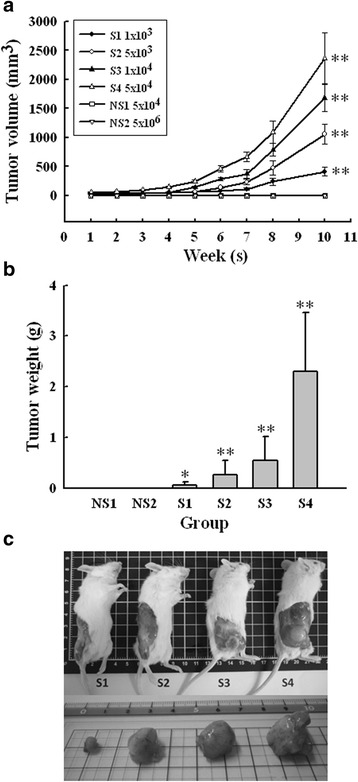
Side population cells (S1-S4) possess higher tumorigenicity than non-side population cells (NS1-NS2). a The growth curve of xenograft tumor. NOD/SCID mice were inoculated subcutaneously with various cell numbers of SAS SP and non-SP cells, respectively, as indicated. Tumor volumes were recorded on a weekly basis. **p < 0.01, significant difference vs. NS1. b The wet weight of tumors measured after harvested at the end. *p < 0.05; **p < 0.01, significant difference vs. NS1. c Representative photographs of the tumors harvested at the end of experiment
