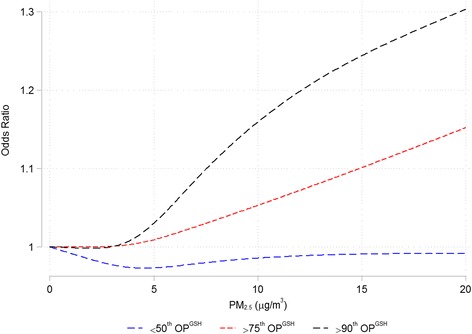
Fig. 5.

Concentration response plots for PM2.5 and risk of MI. Legend: Concentration response plots for PM2.5 and risk of emergency room visits for myocardial infarction below the 50th percentile (blue) and above the 75th (red line) and 90th percentiles (black line) of OPGSH using cubic splines with 4 knots. All models are adjusted for 3-day mean ambient temperature and relative humidity
