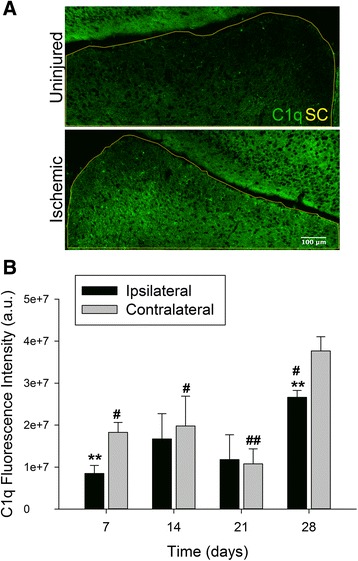
Fig. 2.

Local ischemic injury in the retina increases expression of C1q in the SC. (a) Representative images displaying differences in C1q expression between hemispheres of the SC 7 days following retinal I/R. Yellow outline indicates area of SC measured, scale = 20×. (b) Quantification of fluorescence intensity indicated significant differences between ipsilateral (uninjured) and contralateral (ischemic) hemispheres on days 7 and 28 (p < 0.01). C1q expression was greatest on day 28 in both hemispheres of the SC, and significantly different versus all time points assessed. Mean ± SEM, n = 7 per time point. **p < 0.01 using student’s paired t-test between hemispheres within a time point, #p < 0.05 ##p < 0.01 compared across time points within a group determined via One-way ANOVA followed by Holm-Sidak post test. Scale bars = 100 μm
