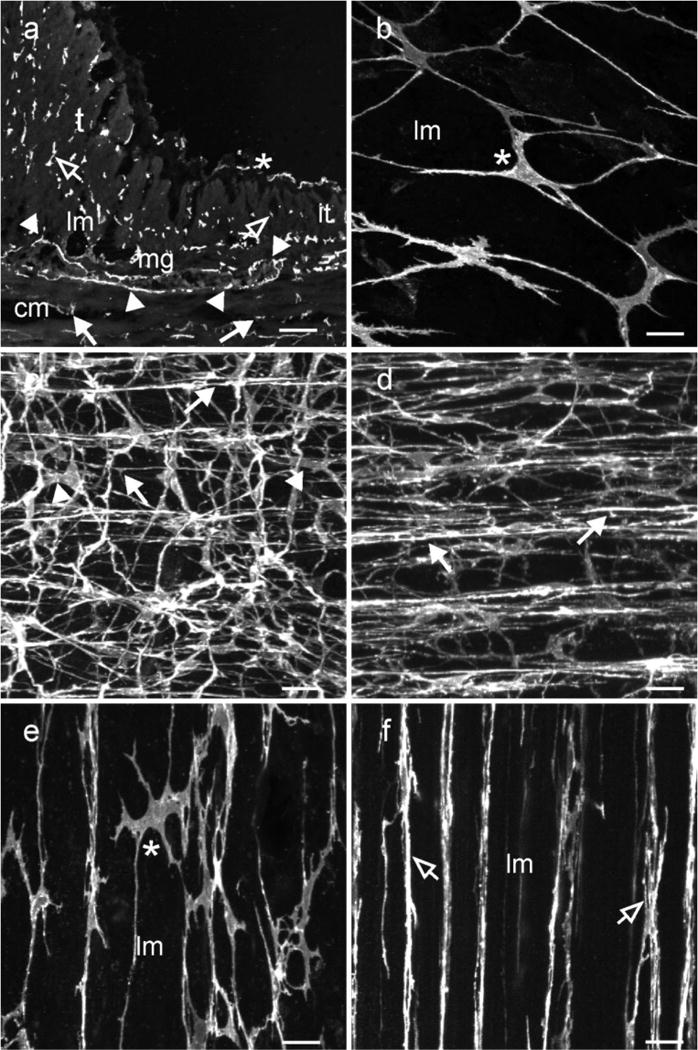
Fig. 4.

Distribution of ICC within the proximal colon. Kit+ ICC were distributed at several anatomical locations within the colonic wall and their density differed in taenia versus inter taenia regions. (a) shows a cryostat section through a region of the colonic wall containing inter taenia (it) and a more pronounced taenia (t) muscle. ICC-MY (arrowheads) can be seen surrounding a myenteric ganglia (mg), located between the circular (cm) and longitudinal muscle (lm) layers. ICC-IM are present within the circular (solid arrows) and longitudinal muscle layers (open arrows). (b–d) show whole mounts of Kit+ ICC along the serosal surface (a,b,e; *) of an inter-taenia region forming a loose interconnecting network and ICC-MY at the level of the myenteric plexus forming a dense anastomosing network (arrowheads; c). The processes that extended from a triangular or oval perinuclear region often bifurcated into multiple processes and contacted adjacent ICC-MY. (d) Shows a dense population of ICC-IM within the circular muscle layer. ICC-IM appeared to form rope-like networks, processes extended from the main axis of ICC-IM to connect with adjacent ICC-IM. ICC-IM were also observed within the longitudinal muscle layer where they ran parallel to smooth muscle cells. (e,f) reveal several distinct populations of ICC within the taenia. Panel (e) shows ICC-SS in the taenia that formed a loose interconnecting network (*). The main axis of these cells ran parallel with the longitudinal muscle cells and lateral projections contacted adjacent ICC forming an interconnecting network. (f) shows a second population of ICC within taenia. This population of ICC-IM was spindle shaped, were distributed throughout the band of muscle and ran parallel to the smooth muscle cells. ICC-IM did not possess the numerous lateral projections seen in ICC along the serosal surface. Scale bars = 100 μm in (a) and 25 μm in (b,c,d,e & f)
