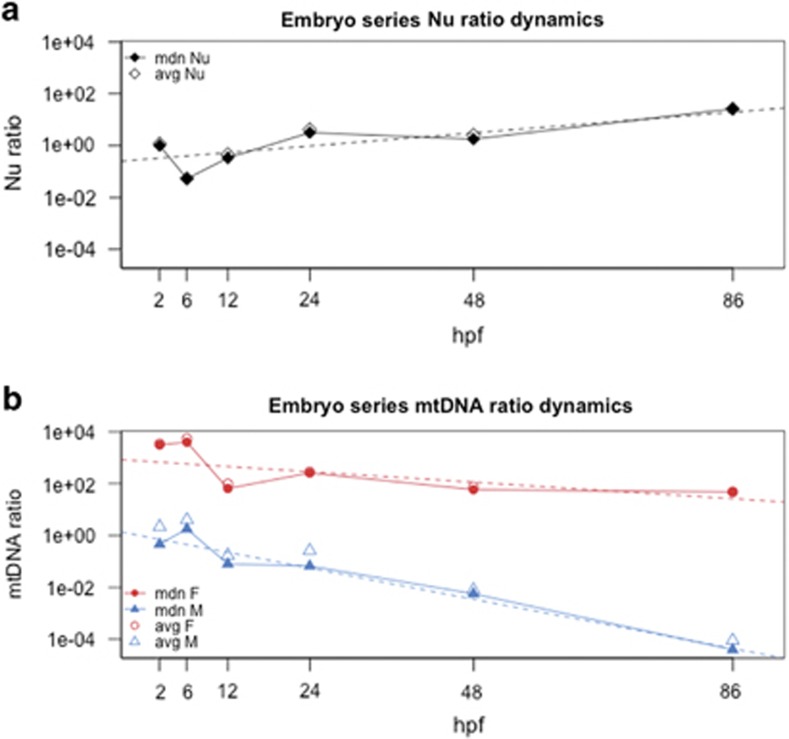
Figure 1.
Dynamics of the three targets in embryos and larvae from 2 to 86 hpf. Full lines, trends of median ratio; dotted lines, linear model trends calculated on all suitable technical replicates (see Results for statistics). Color code: black, nuclear hsp70; red, F mtDNA; blue, M mtDNA. Y axis is in log10 scale. See Table 1 for median absolute deviations and standard deviations of all ratios for each stage. (a) Nuclear target dynamics; stage 2 hpf median nuclear ratio is 1 because the median Cq of this stage has been used as the reference to calculate all nuclear ratios (see Materials and Methods). (b) F and M mtDNA dynamics. avg, average ratio; F, F mtDNA ratio; M, M mtDNA ratio; mdn, median ratio; Nu, nuclear hsp70 ratio.

