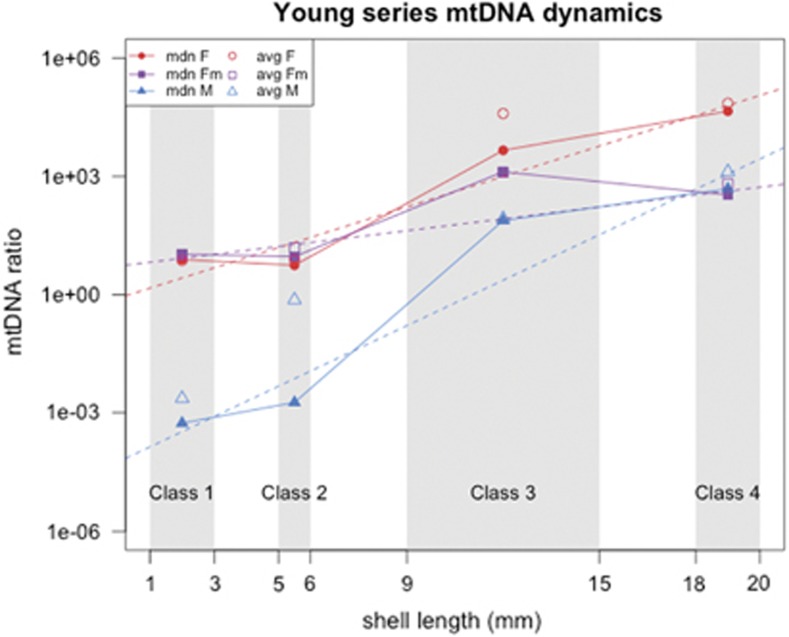
Figure 3.
Dynamics of mtDNA ratios in whole animal and body samples from the young series (specimens from 1 to 20 mm). Full lines, trends of median ratio; dotted lines, ratio linear models. Lines color code: red, F mtDNA in females; purple, F mtDNA in males; blue, M mtDNA in males. Gray squares in the background define the dimensional interval of each class (Table 2), and points are positioned on the average shell length of the respective class (class 1, 2 mm; class 2, 5.5 mm; class 3, 12 mm; class 4, 19 mm) for graphical purposes only. Y axis is in log10 scale. Class 2 values comprise both bodies and whole animals. See Table 3 for ratio statistics, and Results for linear model statistics. avg, average ratio; F, F mtDNA ratio in females; Fm, F mtDNA ratio in males; M, M mtDNA ratio in males; mdn, median ratio.

