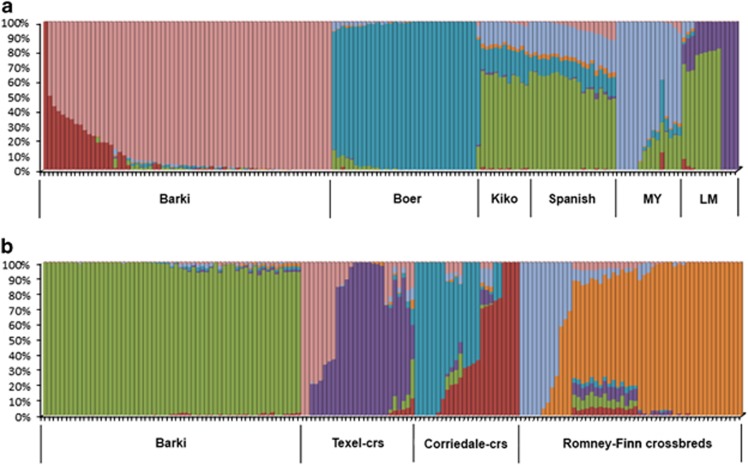
Figure 2.
Individual assignment probabilities generated with ADMIXTURE (1⩽K⩽12) in goats (a) and sheep (b). Each color represents a cluster, and the ratio of colored bars is proportional to the assignment probability of an individual to each cluster. MY and LM represent Myotonic and LaMancha goats, respectively.

