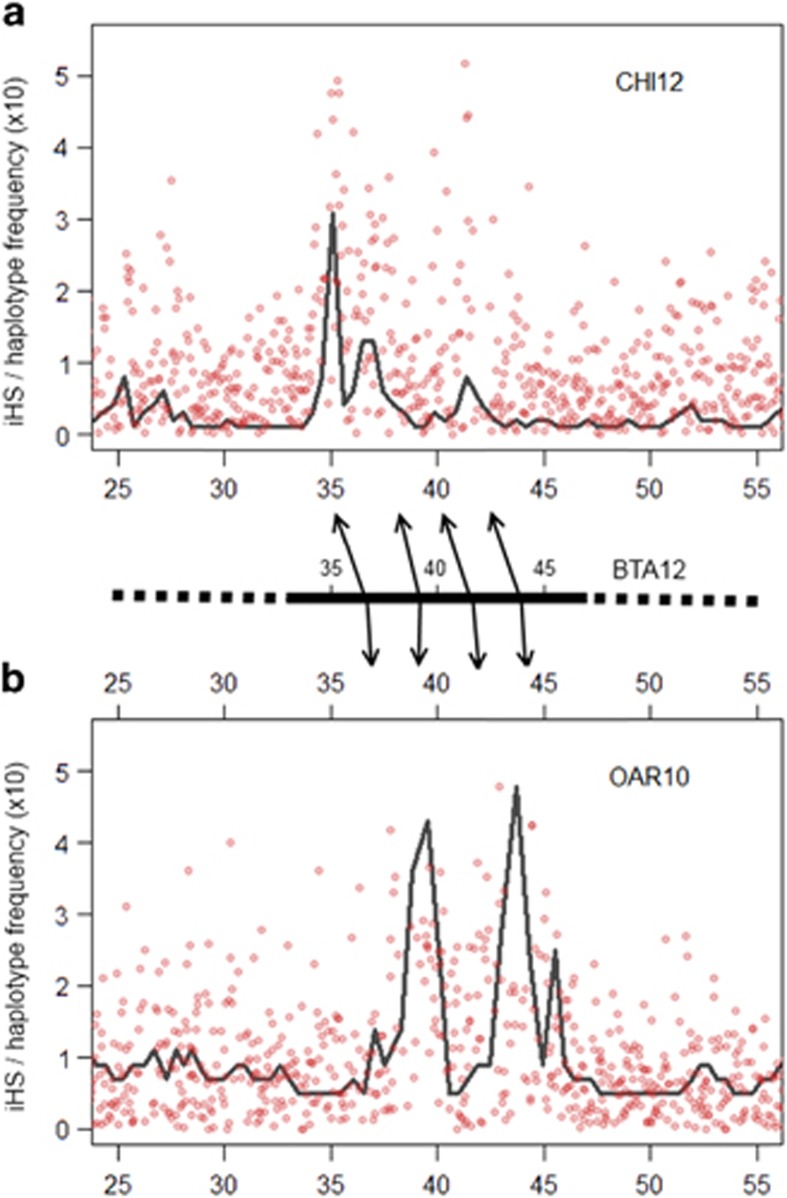
Figure 5.
Comparison of iHS scores between Barki sheep (OAR10) and Barki goat (CHI12). The absolute value of iHS (red circle) was plotted for each locus with the most frequent haplotype using 20-SNP window (black line) for each SNP position in Barki goats (a) or Barki sheep (b). The map position conserved in cattle is displayed with reference to the bovine genome assembly UMD3.1 in between (a) and (b). CHI, OAR and BTA represent notations for goat, sheep and cattle chromosomes, respectively.

