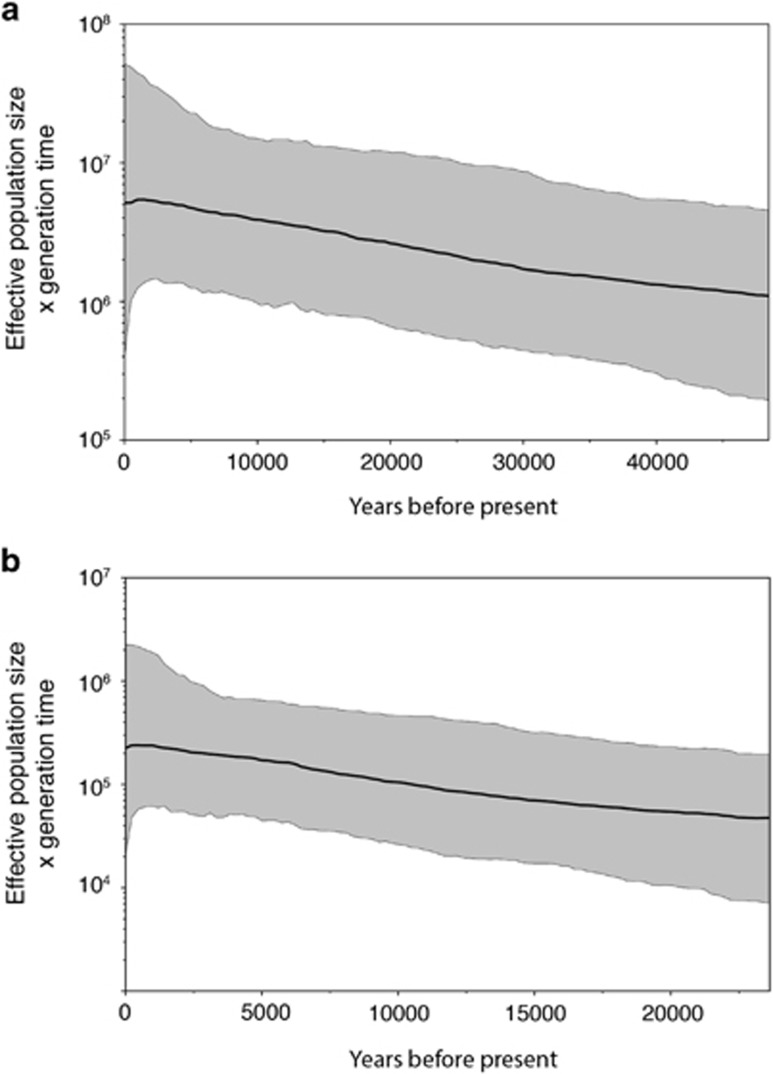
Figure 4.
Bayesian skyline plots showing temporal changes in genetic diversity in Gray's beaked whales (M. grayi) estimated from mitochondrial control region sequences. (a) Using the mutation rate from Dalebout et al. (2005). (b) Using the mutation rate from Ho et al. (2007, 2011). The x axis is in calendar years; the y axis is the product of effective population size and generation time (Nefτ). Grey shading indicates the 95% credibility intervals.

