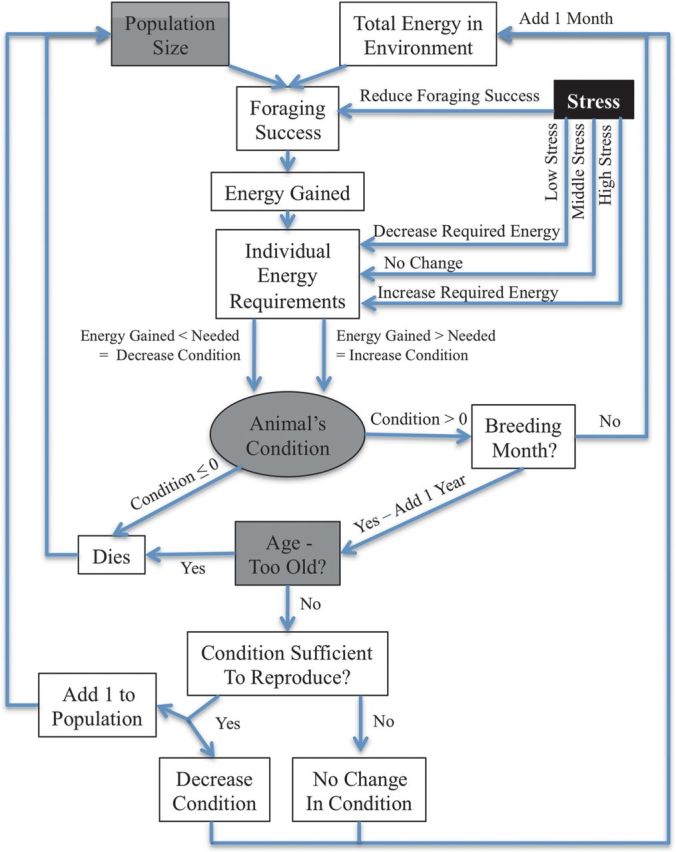
Figure 1:

Conceptual representation of the model for each individual at each time step. The logic follows from population-level processes to individual-level processes, and then completes the loop using the state of the individuals as a group as the state of the population. See text for mathematical computations. Blocks in grey indicate variables that were recorded to compare the relative impact of individual traits on the population size. The black block represents the average level of stress in the population and was varied for subsequent runs of the model. The traits in grey were then compared as average levels of stress in the population changed in order to determine the effect of stress on the population.
