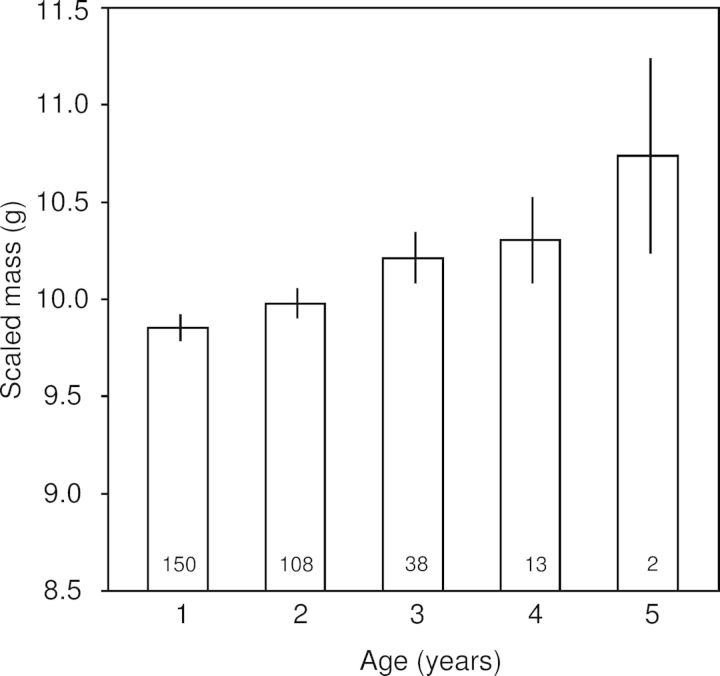
Figure 2:
The variation in scaled mass among crimson finches by age. Least-squares means (±SEM) of scaled mass (in grams) by age. Scaled mass trended positively with age, but the variable age was no longer significant in the model after Bonferroni correction. Sample sizes are given within each bar. Other condition indices did not vary significantly by age and are not illustrated here.

