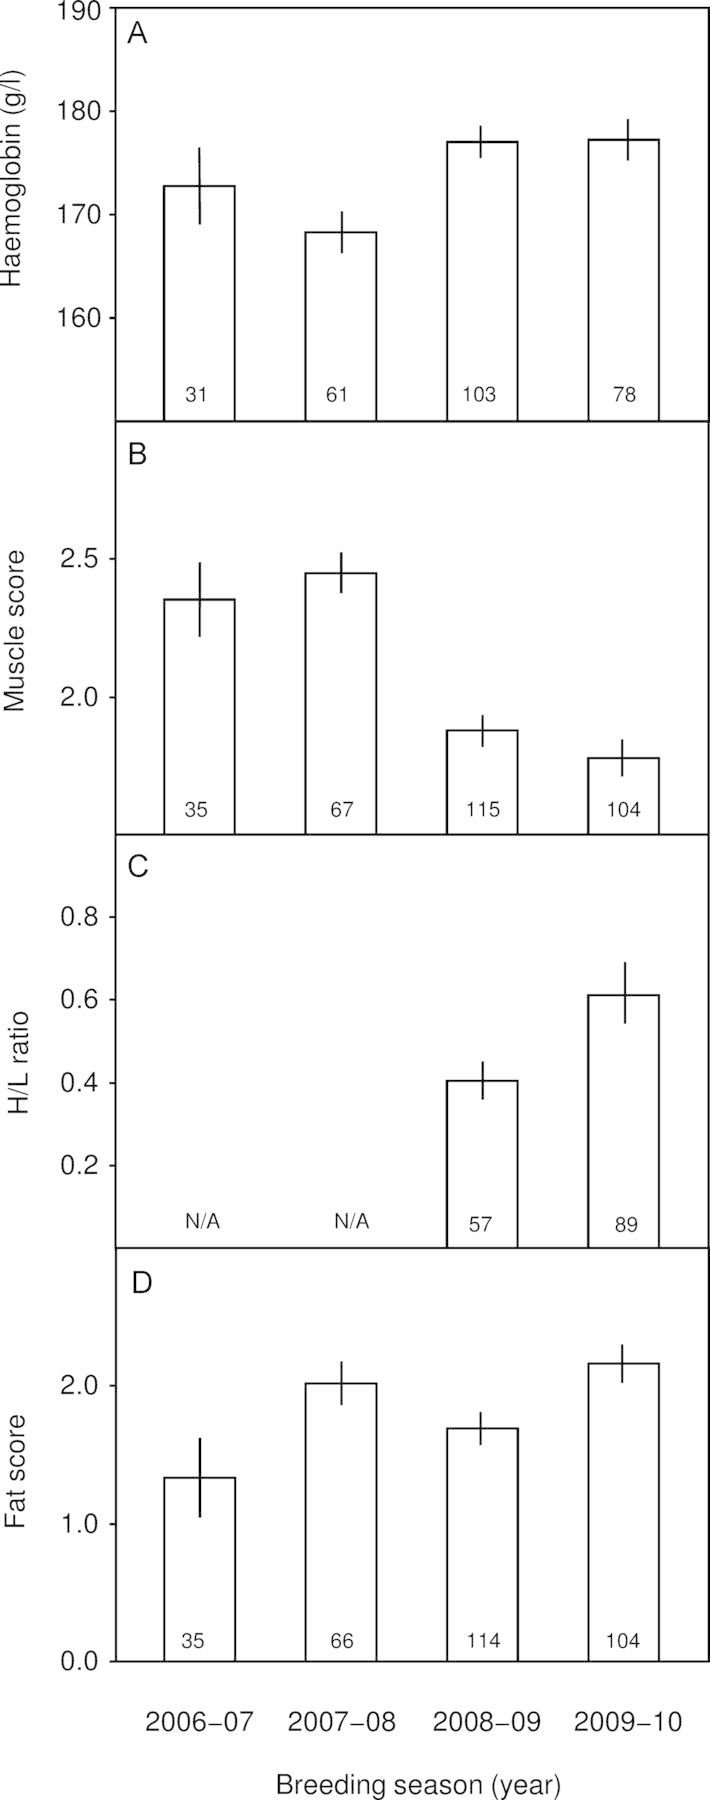
Figure 3:

Annual variation in haemoglobin, muscle, H/L ratio, and fat score among crimson finches. Least-squares means (±SEM) of haemoglobin (A), muscle score (B), H/L ratio (C), and fat score (D) by year. We include the H/L ratio and fat score here because they trended with year (both P-values = 0.002) even though these trends were not significant after Bonferroni correction. The H/L ratio values (C) were back transformed from a base e log to a linear scale. Sample sizes are given within each bar. Other condition indices did not significantly vary by year and are not illustrated here.
