
Figure 2:
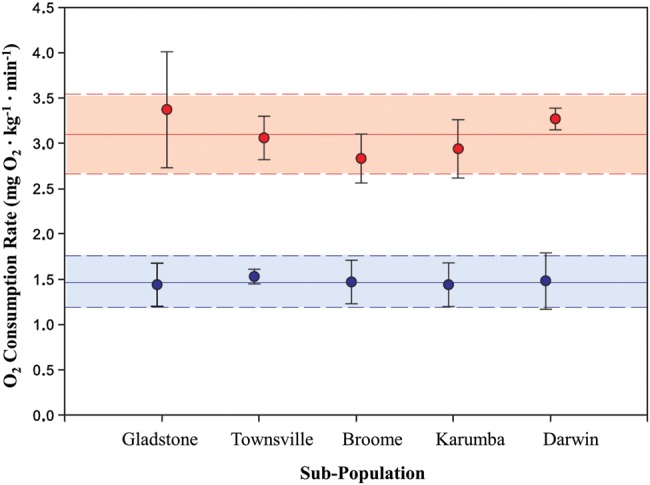
Resting oxygen consumption rates (in milligrams of O2 per kilogram per minute; means ± SD) for five barramundi sub-populations at 26°C (blue; n = 48) and 36°C (red; n = 59). Oxygen consumption rates were calculated from the average slope of the decline in chamber [O2] across a 15 min period during the ‘closed’ cycle of intermittent flow-through respirometry, and measured every 45 min. The continous and dashed horizontal lines represent the mean and standard deviation for all populations at each temperature.