Figure 3:
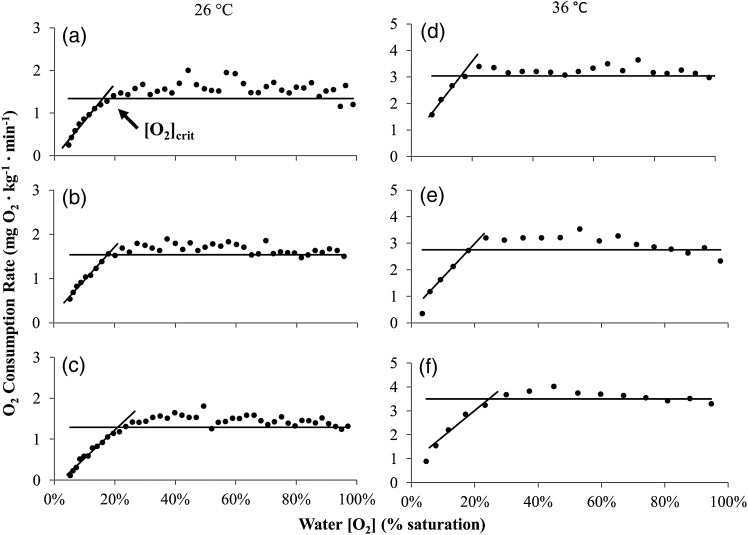
Representative graphs displaying oxygen consumption rate  as water oxygen concentration (percentage saturation) decreases for six individuals from three barramundi populations at 26 and 36°C. Populations are indicated by each panel as follows: Gladstone (a and d), Broome (b and e) and Darwin (c and f). The
  was calculated from the average slope of the decline in chamber [O2] for every 5 min period. The critical oxygen saturation ([O2]crit), indicated by the arrow in the top left panel, was calculated from the intersection between two linear regressions; one for pre-hypoxia
  , and a second for the steep decline in
  during the later stages of the [O2]crit test. Fish took ∼4 h to deplete oxygen within the chambers at 26°C and ∼1.5 h at 36°C. The difference in the vertical scale for fish at 26 and 36°C reflects the increased
  of barramundi at the higher temperature.

