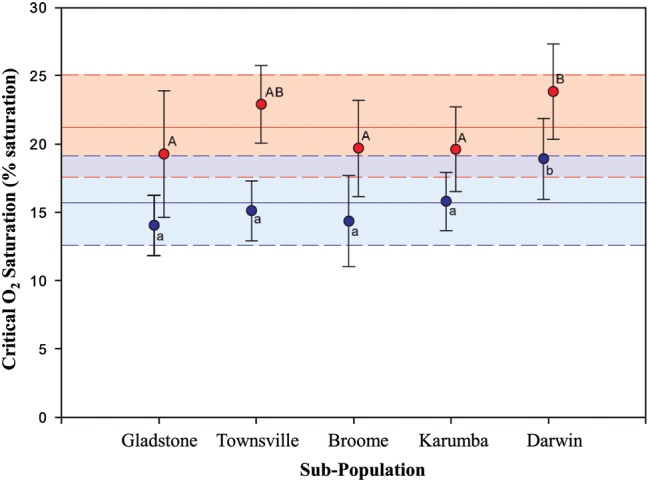
Figure 4:

Mean critical oxygen saturation (percentage saturation; mean ± SD) for five sub-populations of barramundi at 26°C (blue; n = 50) and 36°C (red; n = 63; populations given in Fig. 1). The continuous and dashed horizontal lines represent mean and standard deviation, respectively, of critical oxygen saturation for all populations at each temperature. Letters indicate significant differences (P < 0.05; a < b and A < B).
