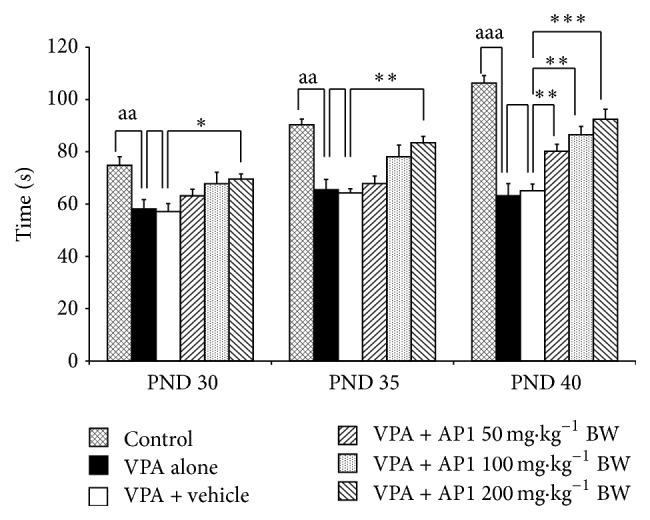
Figure 4.

Effect of AP1 on social behavior. Data are presented as mean ± SEM. aa p value < 0.005, aaa p value < 0.001, compared to the control group. ∗ p value < 0.05; ∗∗ p value < 0.005; and ∗∗∗ p value < 0.001, compared to the VPA-treated group that received the vehicle.
